☝️ EUR/USD Bearish Break Ends Uptrend but Bulls Could Reappear ☝️


Dear traders,
the EUR/USD is showing a strong bearish breakout below the uptrend channel and key support zone.
The break is changing the dynamics of this pair and has erased the previous uptrend without reaching the expected target at 1.1925.
How far can the bears push price action lower? And when is a downtrend finally confirmed?
Price Charts and Technical Analysis
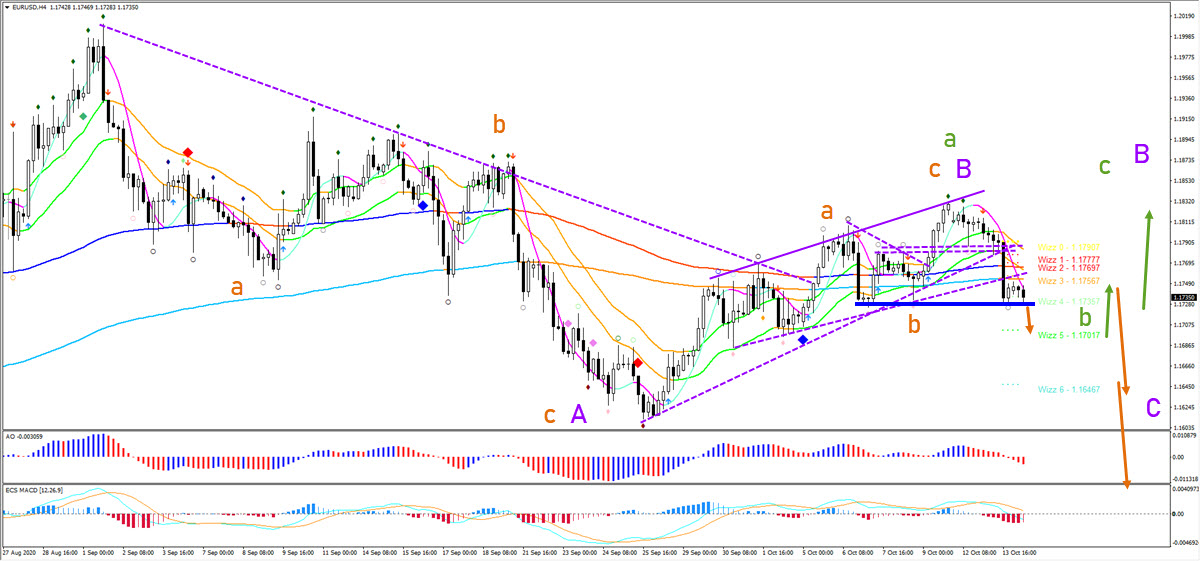
The EUR/USD bearish breakout confirms the end of the uptrend. But a downtrend is still far from confirmed. But price action would need to create a lower high first of all. Despite the bearish breakout, a bullish bounce to test the broken support is therefore likely.
The breakout above the resistance or support will then confirm the direction of the next price swing (arrows). A bearish breakout indicates a wave C (purple) whereas a bullish breakout indicates an ABC (green) within wave B (purple).
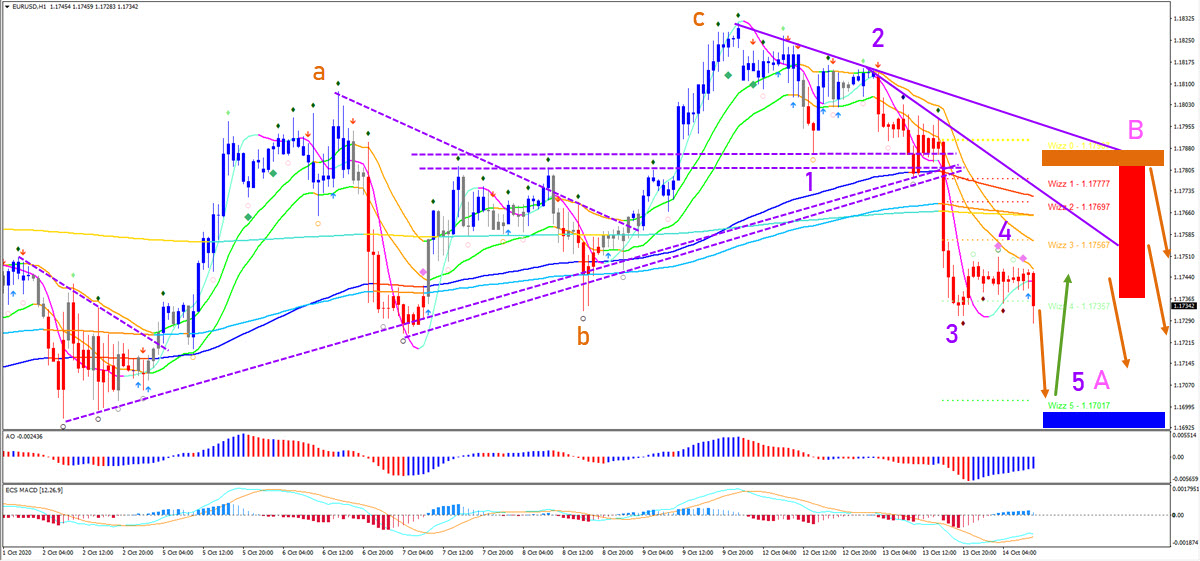
On the 1 hour chart, price is expected to make a dip to complete wave 5 (purple). Then price action could make a rally back into the resistance (red box), which will create a lower high.
The main question is whether price action will break above the key resistance zone (orange box) or below the support zone (blue box). This will determine the next price swing.
At this moment, it’s close to a coin toss, but in my view, the bullish scenario still has an edge. For now, price action is expected to drop, bounce, and drop (see arrows).
The analysis has been done with the indicators and template from the SWAT method (simple wave analysis and trading). For more daily technical and wave analysis and updates, sign-up to our newsletter.
Good trading,
Chris Svorcik


Leave a Reply