❗️ EUR/USD Bear Flag Pattern Aims at 1.1650 ❗️


Dear traders,
the EUR/USD is testing the Fibonacci support levels. Price action is expected to make a bullish reversal at the Fibs despite the bearish breakout.
How far can price fall before finding support? And what are the bullish targets? Let’s review.
Price Charts and Technical Analysis
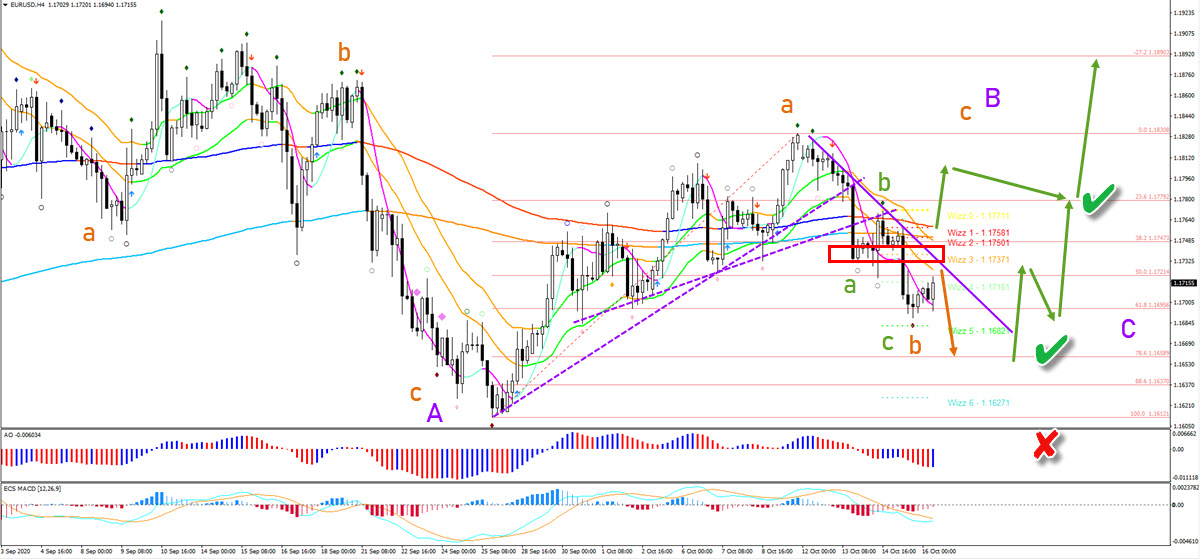
The EUR/USD has reached the 61.8% Fibonacci level, but we are expecting a deeper push lower. The main target is the 78.6% Fib around 1.1650.
The resistance levels (red box) and the 21 ema zone are expected to stop price action from moving higher. Only a breakout above the long-term moving averages would indicate an immediate push up.
Price action should make a bullish bounce at the Fib levels. This would complete a bearish ABC (green) within wave B (orange) and confirm the start of the wave C (orange). Only a break below the bottom invalidates the current ABC (orange) wave pattern.
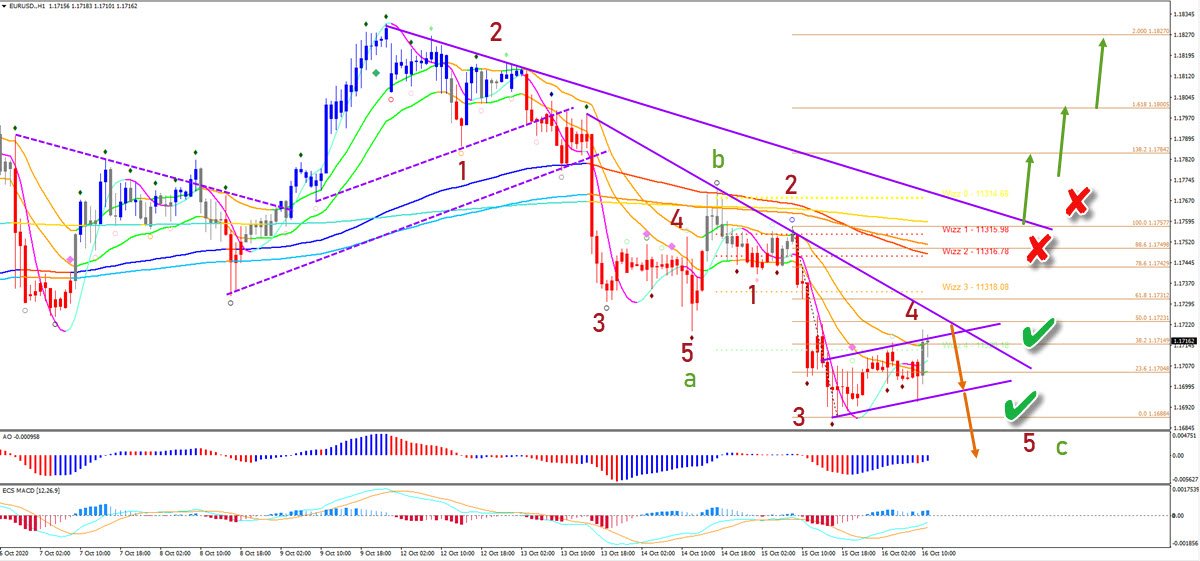
On the 1 hour chart, we see the main reason why one more bearish price swing is anticipated. The bear flag chart pattern is typical for a wave 4 (red) after price action showed a strong bearish impulse (wave 3).
The wave 4 is invalid if price action is able to break above the bottom of the wave 1 (red x). Also candlesticks that fully break above the 21 ema zone could be a first warning of a pending change in direction.
The analysis has been done with the indicators and template from the SWAT method (simple wave analysis and trading). For more daily technical and wave analysis and updates, sign-up to our newsletter.
Good trading,
Chris Svorcik


Leave a Reply