🚀 EUR/NZD Showing Bullish Wave 3 Pattern After Moving Up 200+ Pips 🚀

Dear traders,
the EUR/NZD is showing a strong bullish reversal at the Fibonacci levels and bullish breakout above the resistance. The bullish outlook was expected in our previous analysis where we analysed that a reversal was around the corner.
This article will review whether the reversal can go up even more and if so, what kind of targets are within reach.
Price Charts and Technical Analysis
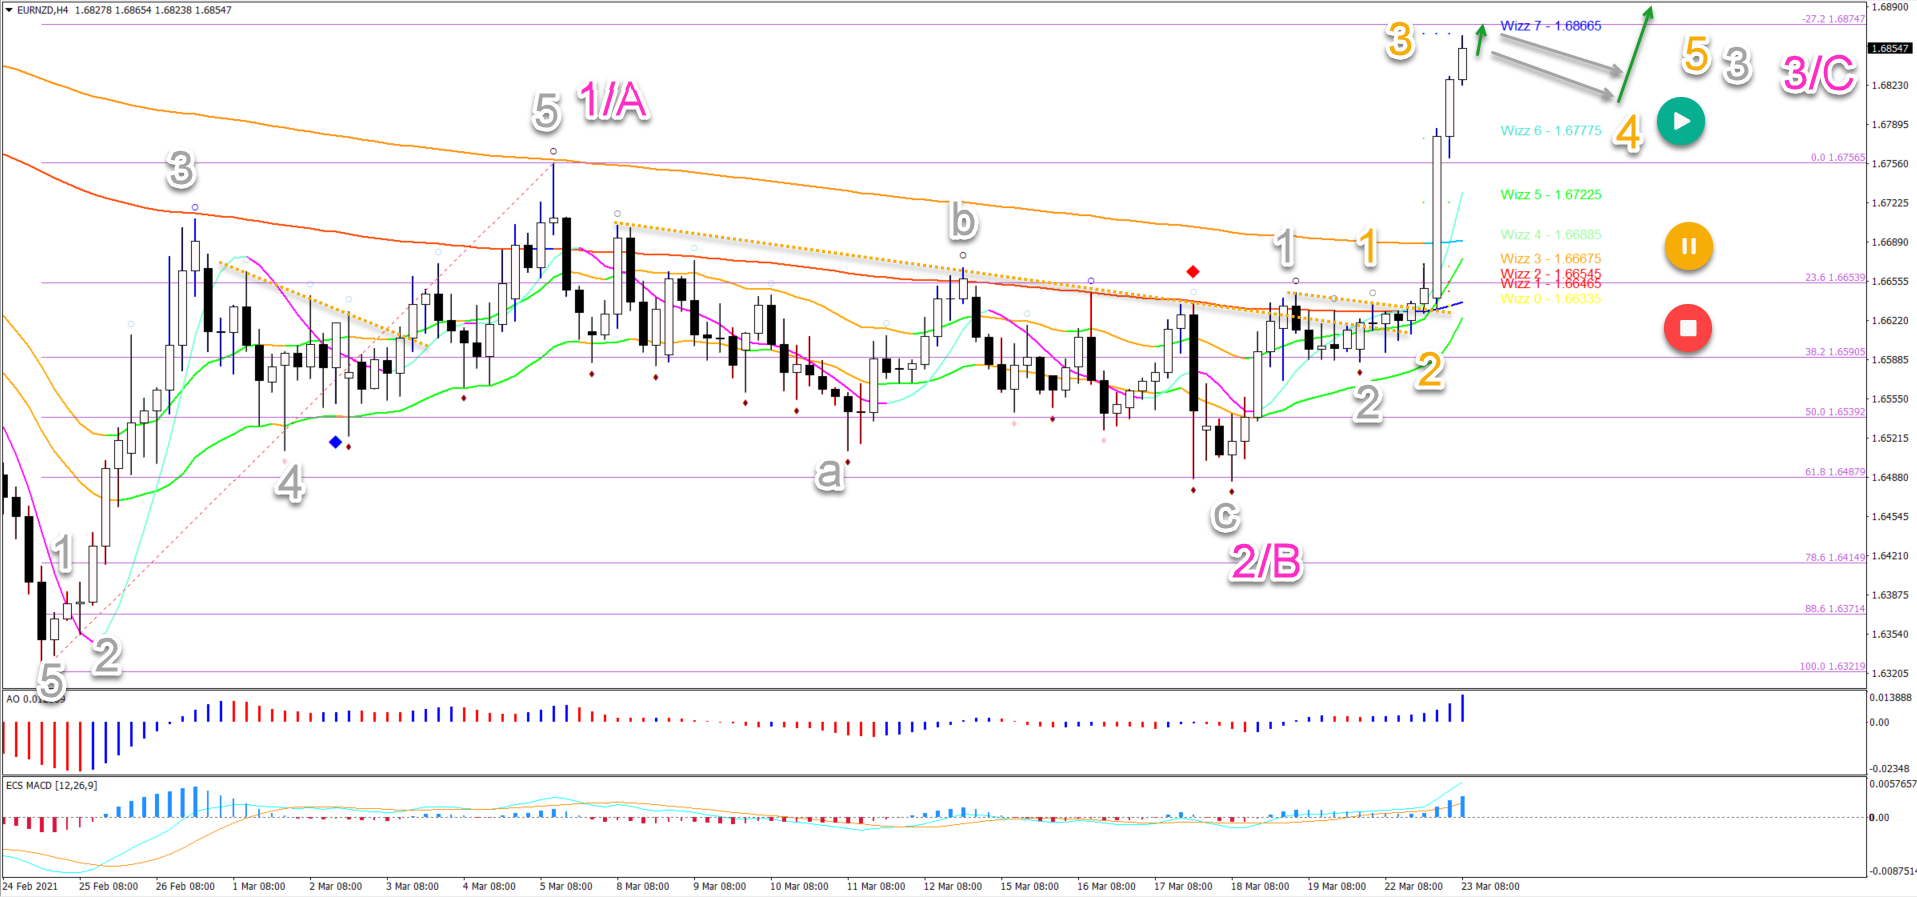
The EUR/NZD made a strong bullish breakout above the resistance trend lines (dotted orange lines). This occurred after price action completed an ABC pattern (grey) without breaking the bottom of wave 1 or A (pink).
- The bullish bounce at the 61.8% Fibonacci retracement level is typical for a wave B zigzag pattern of an ABC (pink).
- But price could also be building a larger 123 pattern (pink) as well. This depends on how far the price will move up in the third wave.
- Currently price is closing to reaching the -27.2% Fibonacci target. A break above the -100% Fib target indicates a wave 3. Anything below that could be either a wave 3 or C.
- Price action could make a retracement at the -27.2% Fibonacci target and Wizz 7 Fibonacci confluence level for a pullback.
- The pullback should be shallow and show a continuation pattern such as a bull flag (grey arrows) if the uptrend is to remain valid.
- A break above the pattern (green arrow) indicates the continuation.
- Only a deeper pullback places the uptrend scenario on hold (yellow button) or invalidates it (red button).
On the 4 hour chart, price action is showing a wave 1-2 pattern. The current strong impulse – which broke above the -100% Fibonacci target – is typical for a wave 3 (orange), either of a larger wave C or 3 (pink) which is yet to be determined.
- The current strong impulse – which broke above the -100% Fibonacci target – is typical for a wave 3 (orange), either of a larger wave C or 3 (pink) which is yet to be determined.
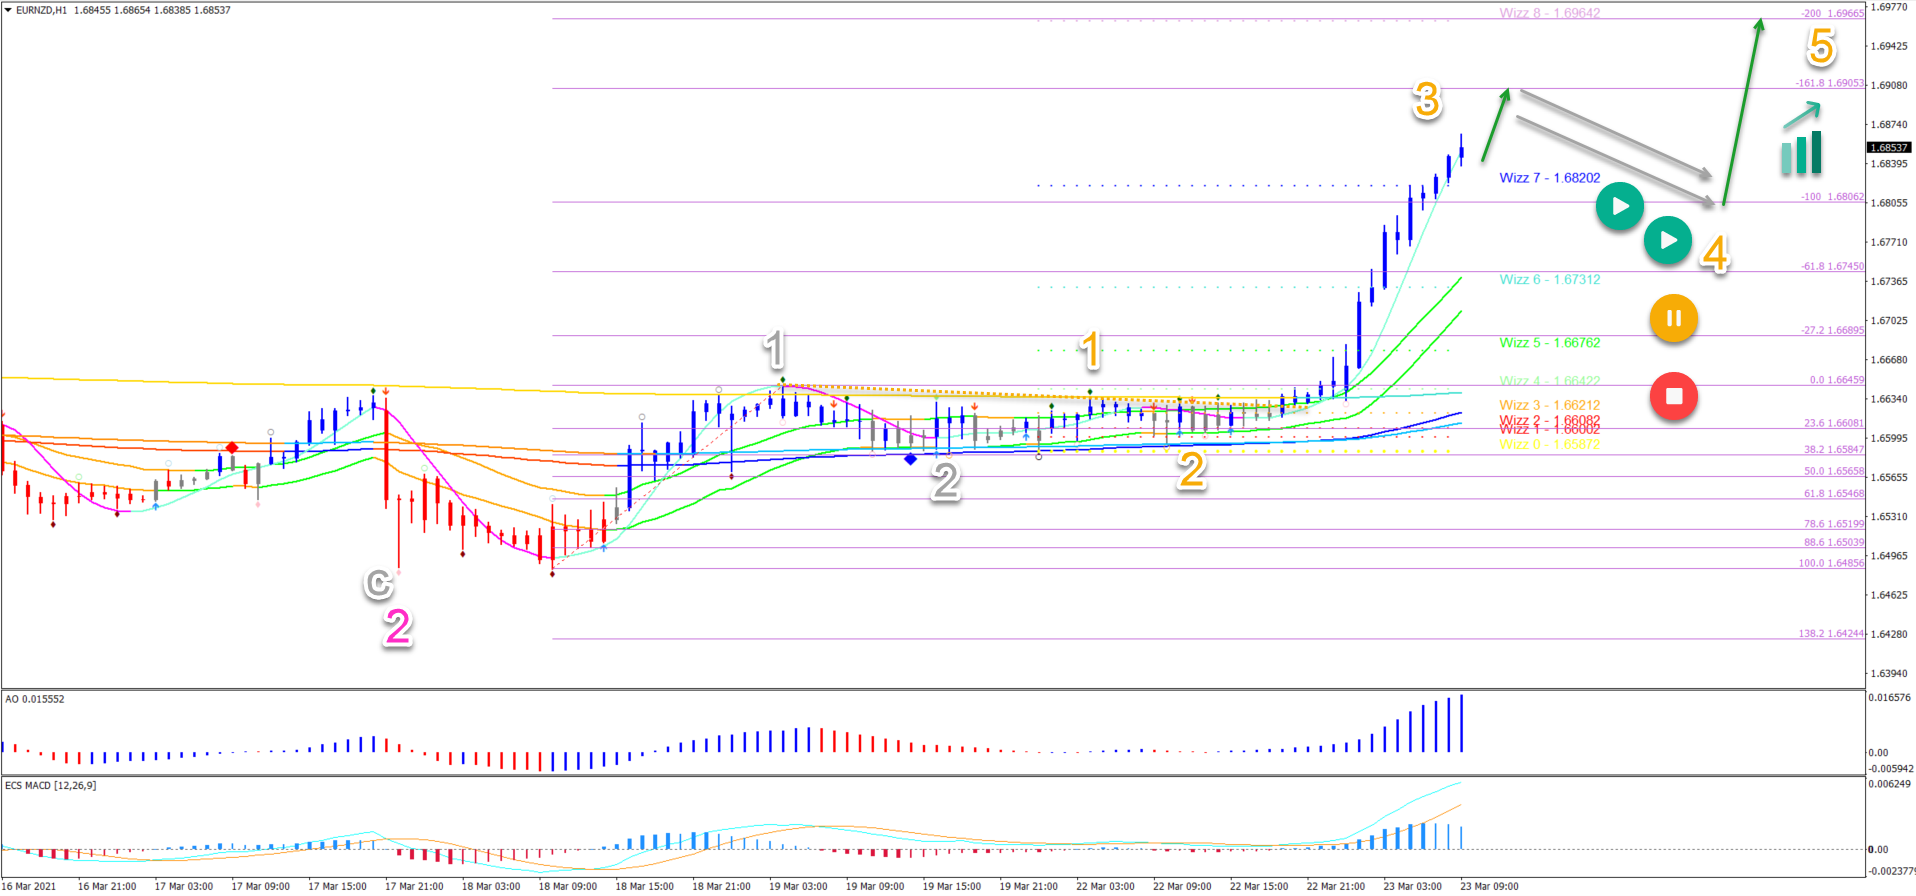
- We are soon expecting some type of pullback. The -161.8% Fibonacci target could be a logical spot for such a retracement.
- A shallow pullback via a bull flag pattern makes the most sense in this case (grey arrows).
- The pullback could go back to the price zone of around 1.6830, 1.6780, or 1.6750 where a bullish bounce is expected (green arrow).
- The main target of the next push up is the confluence at the 1.70 with a Wizz 8 level and -200 FIbonacci target.
The analysis has been done with the indicators and template from the SWAT method (simple wave analysis and trading). For more daily technical and wave analysis and updates, sign-up to our newsletter.
Good trading,
Chris Svorcik


Leave a Reply