GBP/USD ? What on Earth is Going On?! ??
Subscribe
Dear Traders,
The Cable has been on a very mysterious path since Jan 25 high. Are we yet to see another high or has a reversal set in already… and, if so, how is this reversal exactly unfolding?
Today’s analysis will discuss several Elliott Wave scenarios that could be playing out for the GBP/USD.
Scenario #1: Top is in Place
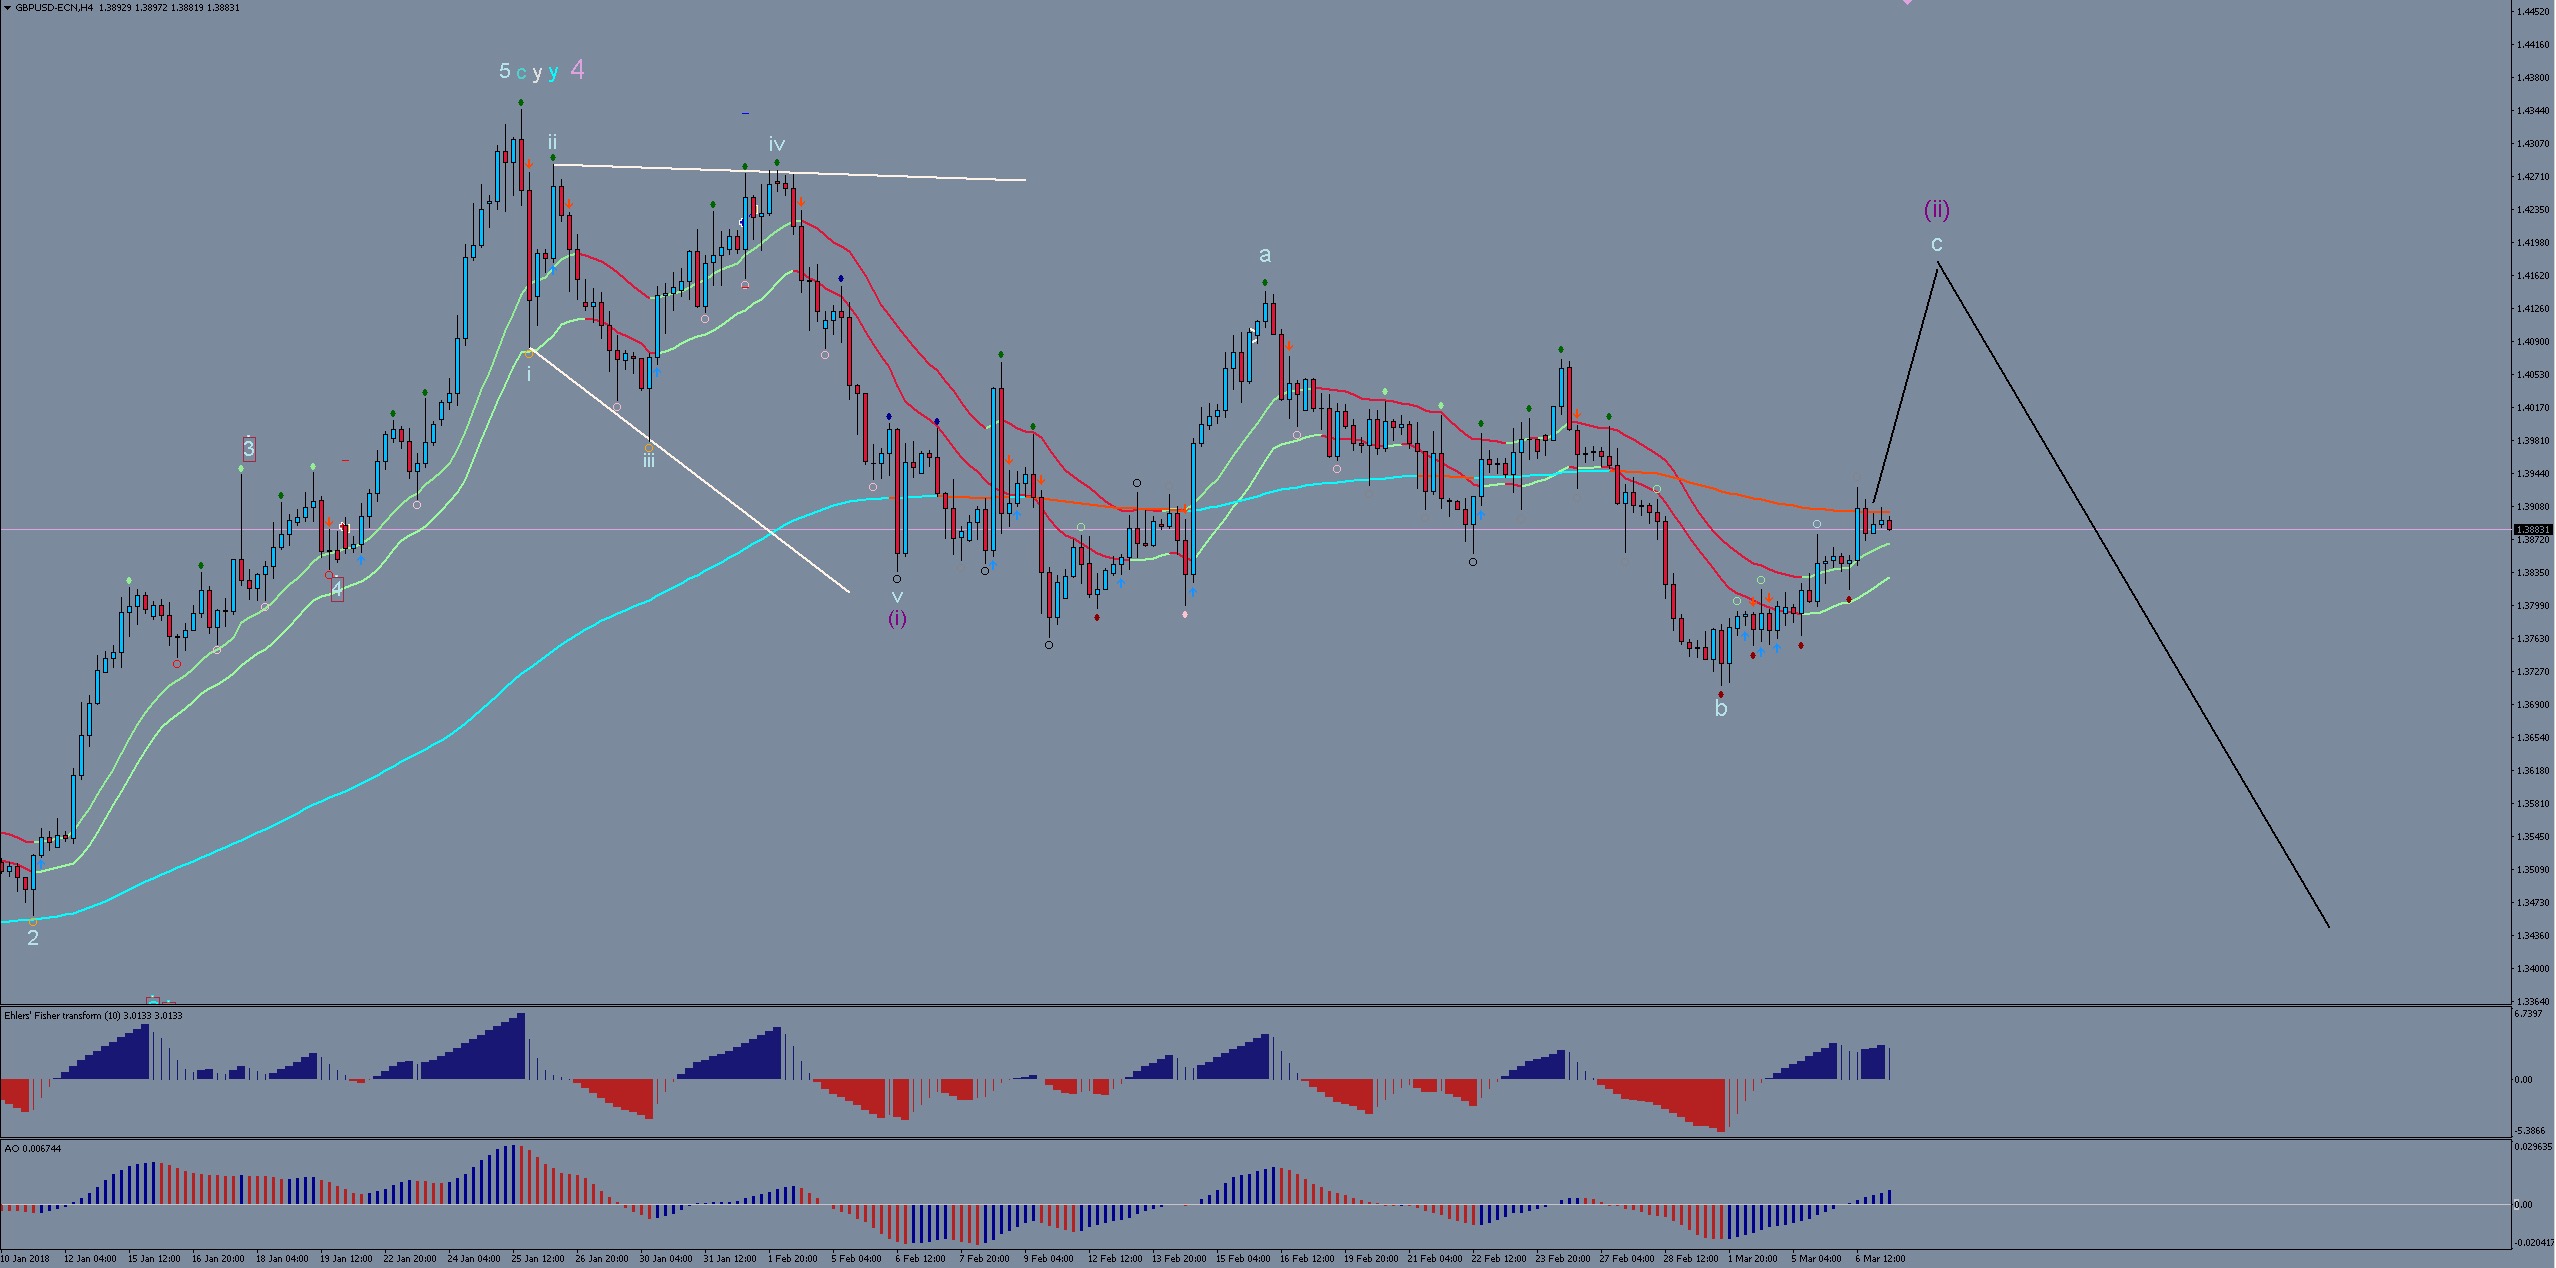
The chart above shows that a top might be in place ever since the Jan 25 high. In this case the subsequent price-action breaks down into the following:
- Minuette Wave (i) (purple) of the new down trend is a leading diagonal.
- Minuette Wave (ii) (purple) would be still in the process completing itself, possibly as a large expanded flat, which would mean some more upside before bearish minuette wave (iii) would kick into action and deal a killing blow to the Pound.
Scenario # 2: Top is in Place, but with a Bigger Leading Diagonal

The second chart above shows a very similar situation as in Secnario #1, but with some differences:
- The leading diagonal of minuette wave (i) is larger and has a different subwave structure. Although leading diagonals are generally considered to have a 5-3-5-3-5 sub-structure, various sources report the possibility of different permutations, such as 5-3-3-3-3 or 3-3-3-3-3, the latter of which would apply in scenario #2.
- Minuette wave (ii) would in this case have started at the last low of Mar 1. Scenario #2 means that we could see more complexity play out during the current upwards move (ii) when compared to Scenario #1, which implies mainly one final impulse up before wave (ii) is done and dusted.
Scenario #3: Final High is Yet to be Reached
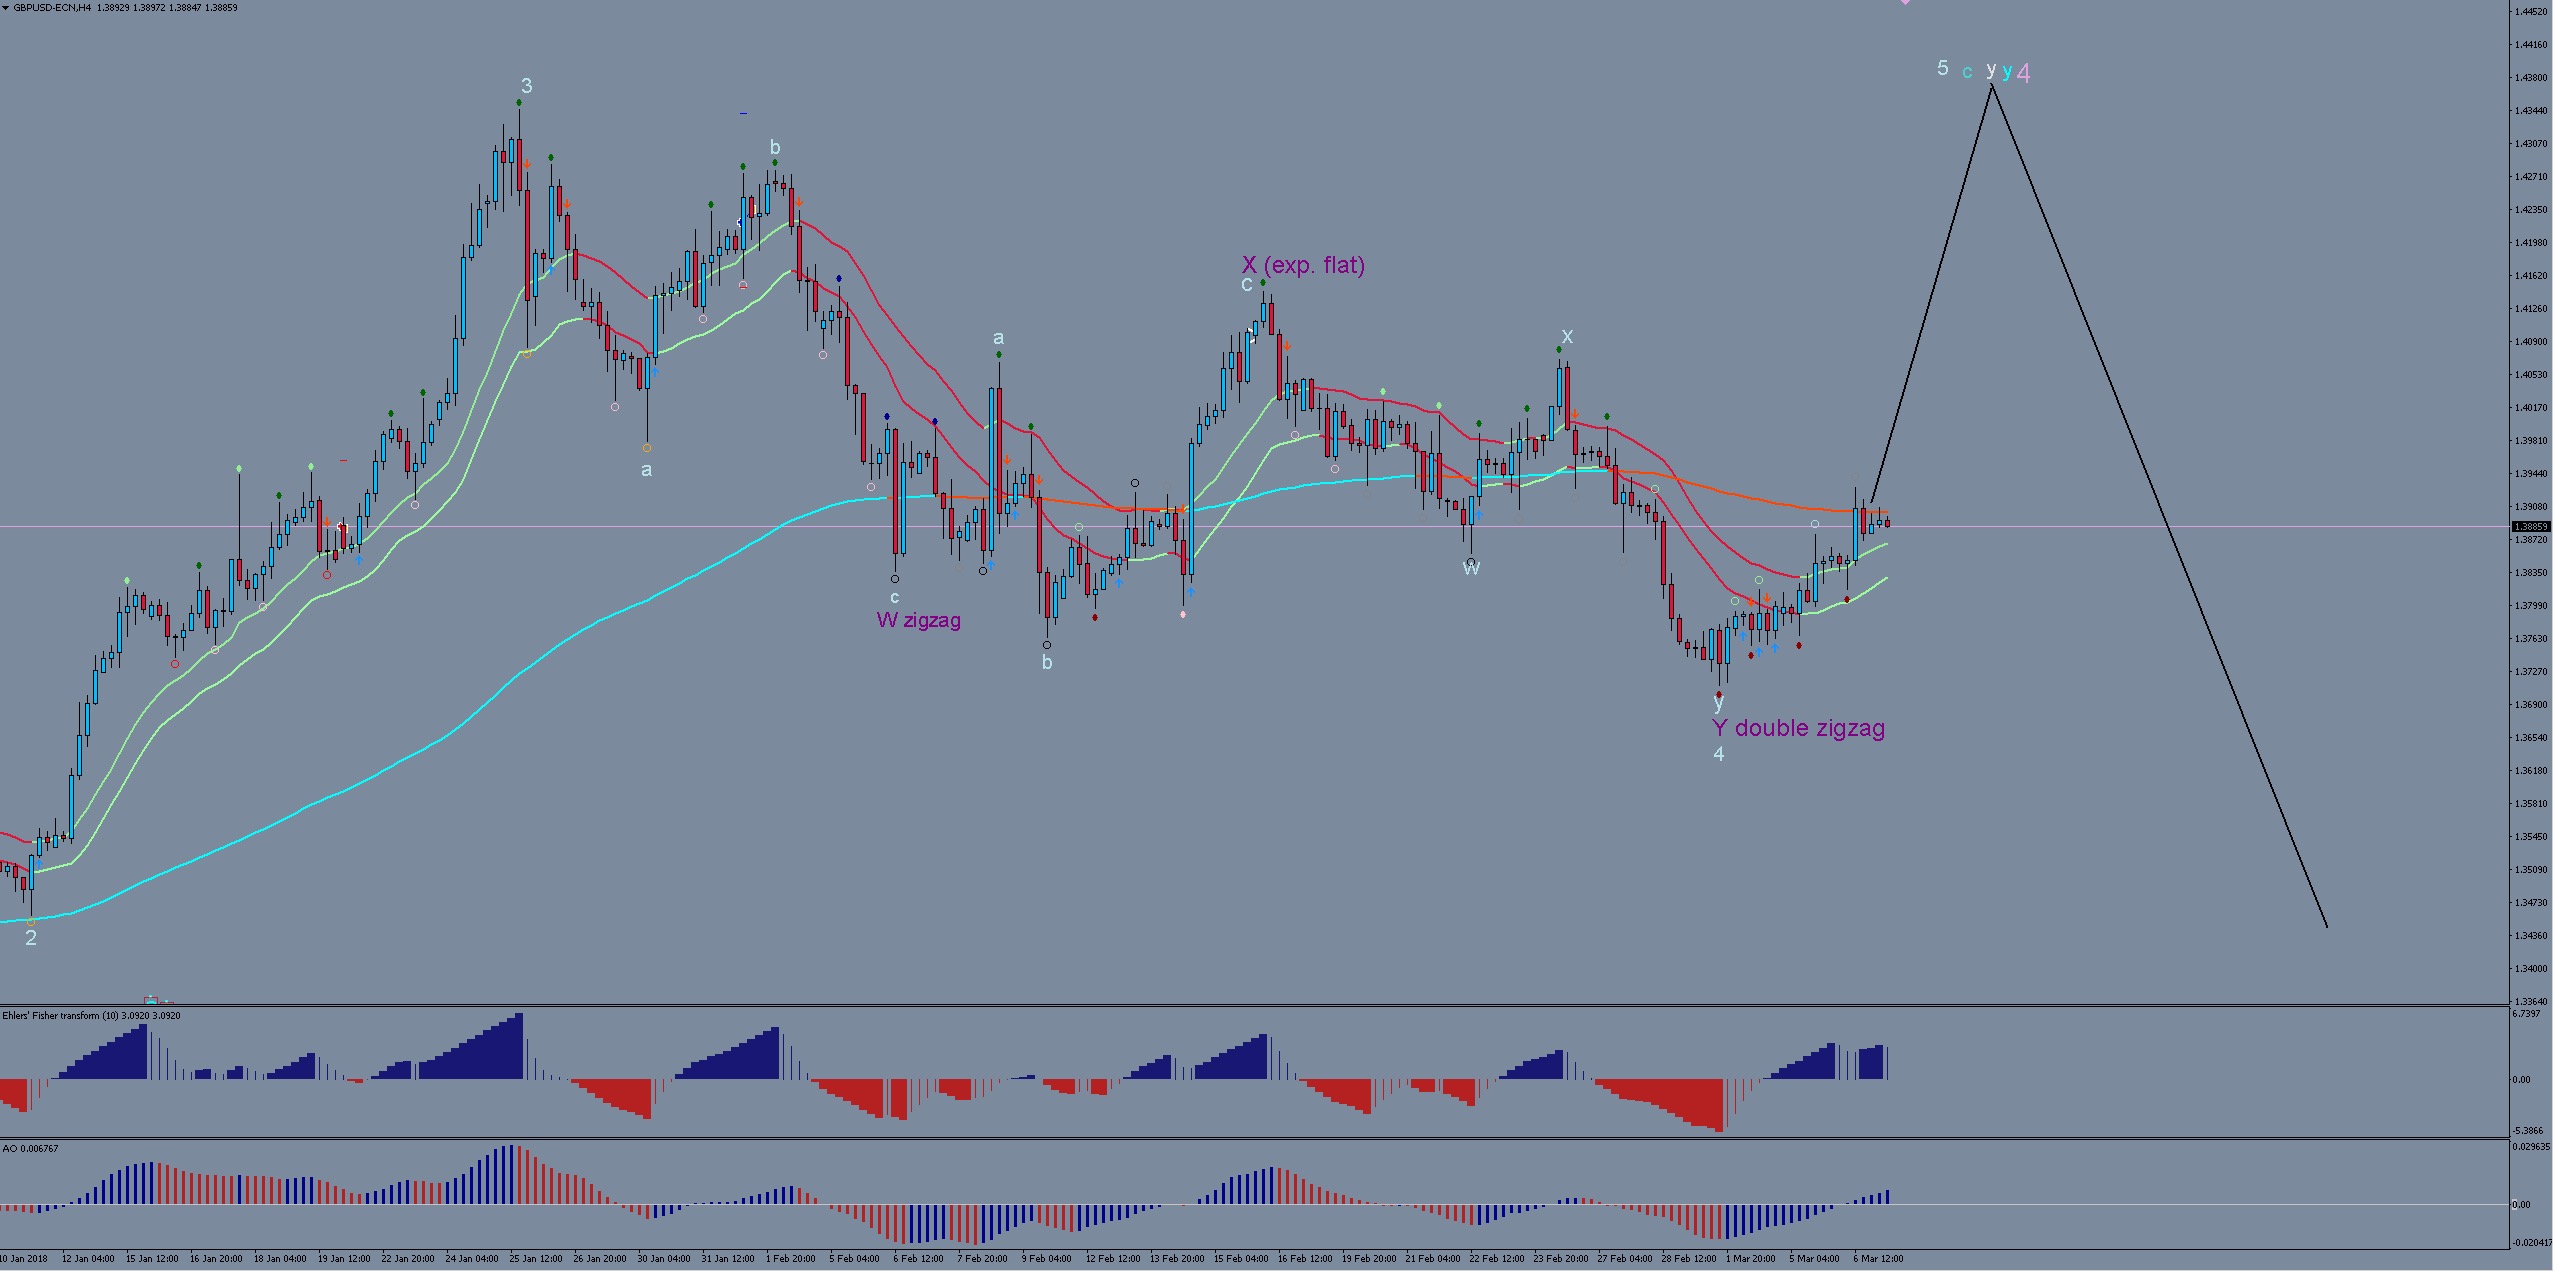
In the 3rd and final scenario above, I leave the possibility open for another high to be created before the long-term Cable correction is finally complete:
- All price action since the Jan 25 high would be part of a very long and complex wave 4, consisting of a zigzag (W), expanded flat (X), and a zigzag (single or double) (Y).
- It would mean that final Wave 5 would have started at the March 1 low, and that a new high will be achieved during this swing. Or at least the Jan 25 high would be matched in the case of a truncated wave 5
What are the Odds?
It is a very difficult situation and there are pros and cons for each scenario:
Scenario #1 fulfills wave rules very well and it is not uncommon to see such price convolution in the early stages of large-scale trend changes. However price was at peak momentum when it reached the Jan 25 high, which most often means wave 3 is completed, with wave 4 and 5 still to form. This has left the door open for another high (i.e. scenario #3). But the weakness with scenario #3 is that the alleged wave 4 is becoming ever more disproportionately large compared to the other waves of the swing which puts serious doubt into this idea. In addition, price-action during potential wave 4 broke even the 61.8% Fibonacci level (of a what would count as wave 3), which is also highly unusual. Scenario #2 has pretty much the same pros and cons as #Scenario 1 but its weakness is the sub-wave structure which is unusual and should generally be more like in scenario #1… 5-3-5-3-5.
Conclusion
I personally am leaning more towards scenario #1 because of the various weaknesses of scenario #3, but it is unfortunately still very hard to tell. In any case, the GBP should appreciate some more in the short-term, regardless of which wave count is correct… the big question mark is simply how high it can go. 1.4150 is a very critical level to watch out for.
All the best along your trading journey…
Hubert
.


Hi, Thanks for your insightful post, you’ve said “However price was at peak momentum when it reached the Jan 25 high, which most often means wave 3 is completed” Would you please inform me what is your favorite momentum gauge? Are you using an indicator or just interpreting price action?
HI Ali, thank you for your comment. I use two indicators for momentum gauging. the Awesome Oscillator, which comes standard with MT4 platform plus the Fisher Oscillator which is more sensitive. This fisher is a custom indicator that comes with the ECS.SWAT course. If you are interested, please email Chris at ECS. Both indicators combined are great for wave analysis validation. All the best to you. Hubert