? GBP/USD Fragile First Steps of Bullish U-turn at 50% Fib ?
Subscribe
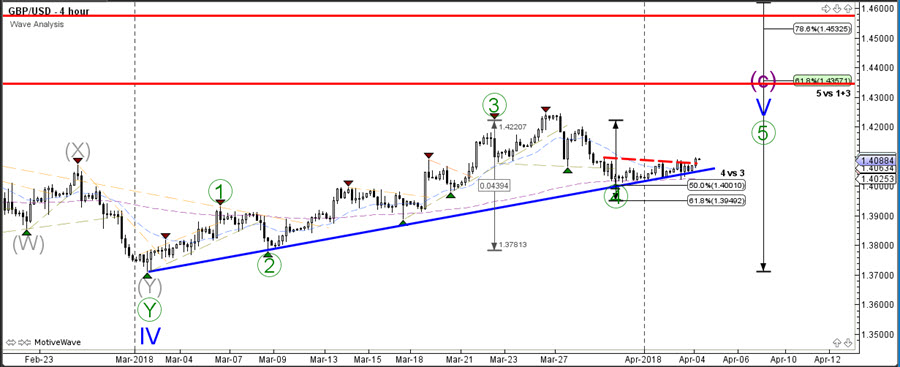
The GBP/USD seems to be making a slow bullish U-turn at the Fibonacci levels of potential wave 4 (green) retracement. The current support zone was key due to the 50% Fib, 1.40 round level, long-term moving average, and support trend line (blue). A bearish break could indicate a reversal whereas a bullish bounce could see price move up within the trend.
GBP/USD
4 hour
1 hour
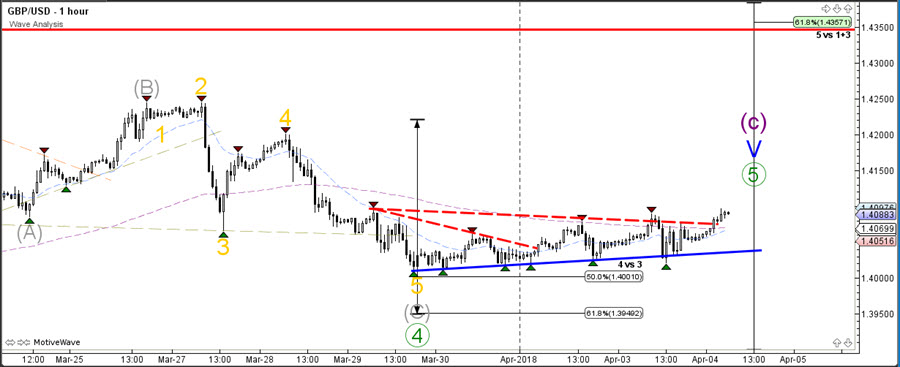
The GBP/USD seems to be breaking the resistance of the triangle chart pattern but price will need to remain above support (blue) otherwise the bullish continuation seems unlikely. A break below the 50 and 61.8% Fibonacci level makes a wave 4 (green) unlikely.
EUR/USD
4 hour
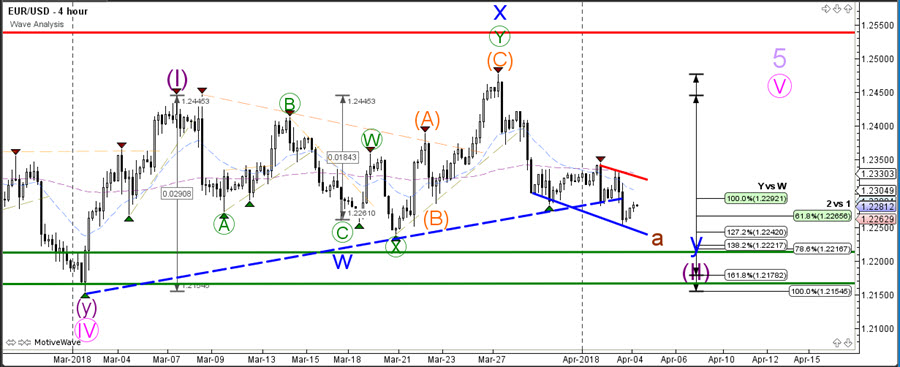
The EUR/USD broke below the support trend line (dotted blue), but solidly remains in a larger consolidation zone with larger support (green) and resistance (red) as main levels. The bearish retracement is either completing a wave 2 (purple) or a wave A of larger bearish ABC (brown).
1 hour
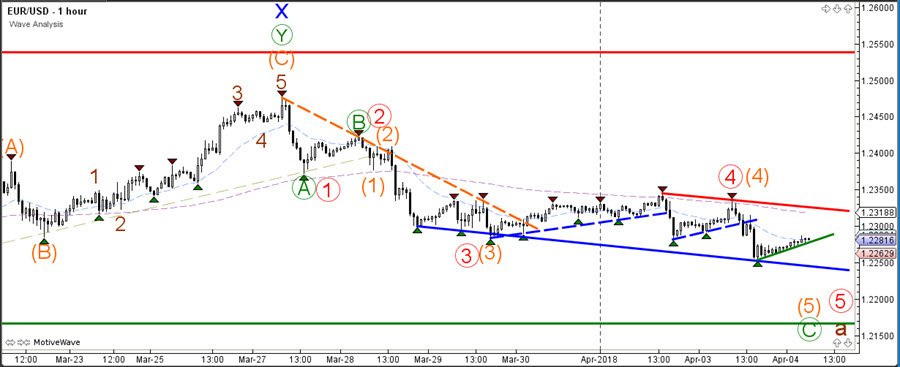
The EUR/USD bearish break could indicate a continuation of bearish wave 5 (orange/red) whereas a bullish break could indicate the start of wave 3 (purple-see 4HR) or wave B of a larger bearish ABC correction (brown).
Good trading,
Chris Svorcik
Elite CurrenSea
.


Images are misplaced
Thank you for the warning! Corrected it just now.