? EUR/USD, GBP/USD Bullish Reversal Patterns Challenge Key Resistance ?
Subscribe
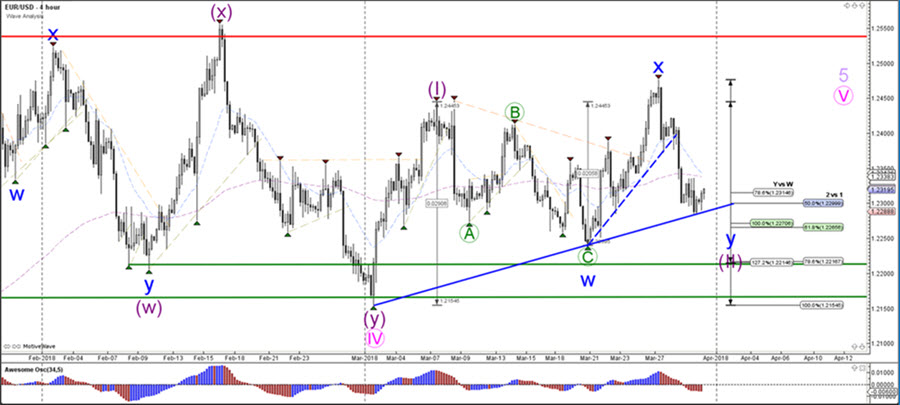
The EUR/USD is testing a new support trend line (blue) and price seems to respecting that zone and building a bullish reversal pattern. This retracement could complete a wave 2 (purple) although an alternative scenario is explained on the 1 hour chart where a larger bearish correction could take place.
EUR/USD
4 hour
1 hour
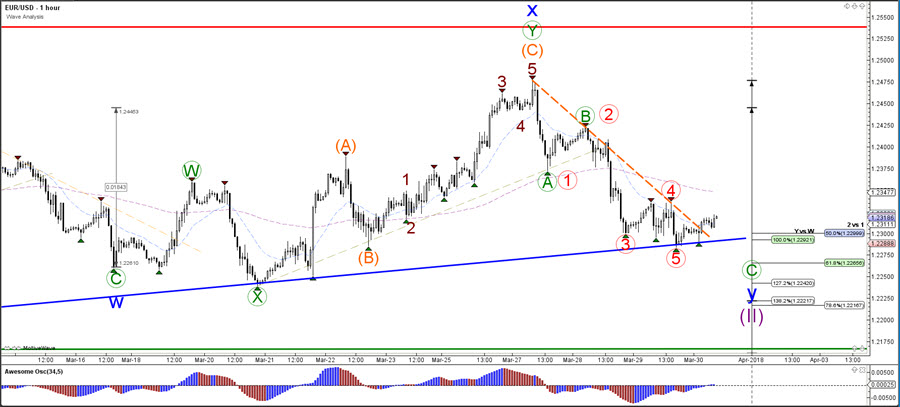
The EUR/USD could have completed an ABC (green) corrective pattern within wave 2 (purple) and the bullish bounce at the support trend line (blue) could start a new uptrend. The alternative is that 5 bearish waves were completed which could be a bearish wave A of a larger bearish ABC. This becomes more likely if the bullish price action shows 3 waves.
GBP/USD
4 hour
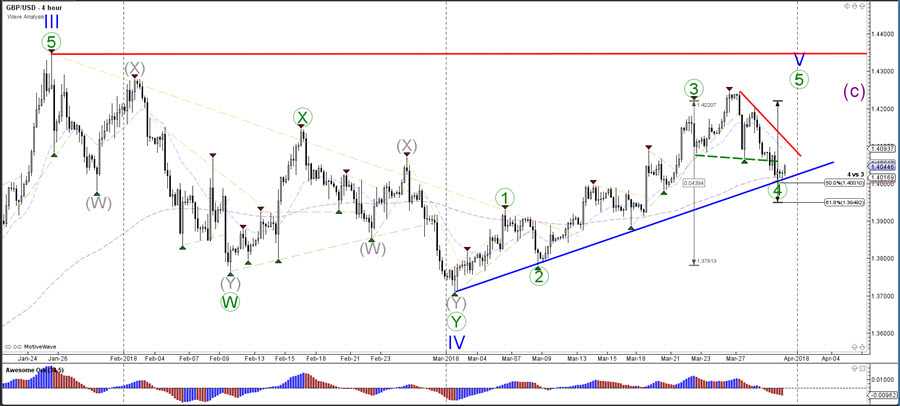
The GBP/USD is expanding the wave 4 (green) retracement and is retesting the Fibonacci levels. Wave 5 (green) could retest the previous top (red).
1 hour
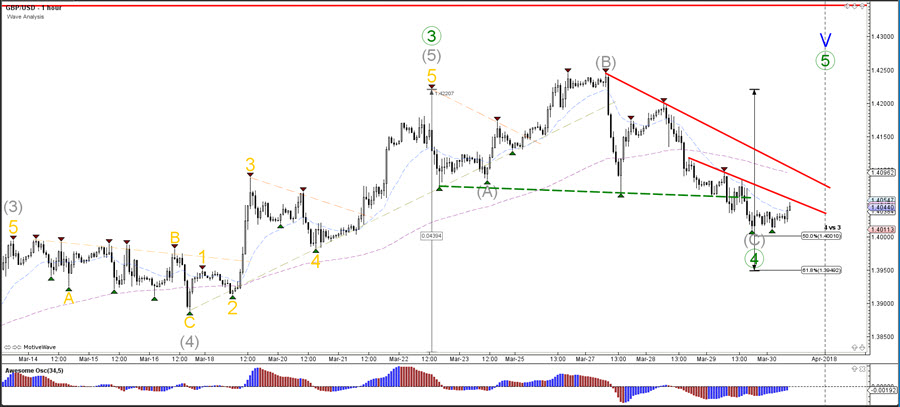
The GBP/USD could be completing a wave C (grey) of a wave 4 (green) retracement but price needs to break above the resistance trend lines (red) before that becomes more likely. A break below the Fibs makes a wave 4 (green) less likely.
USD/JPY
4 hour
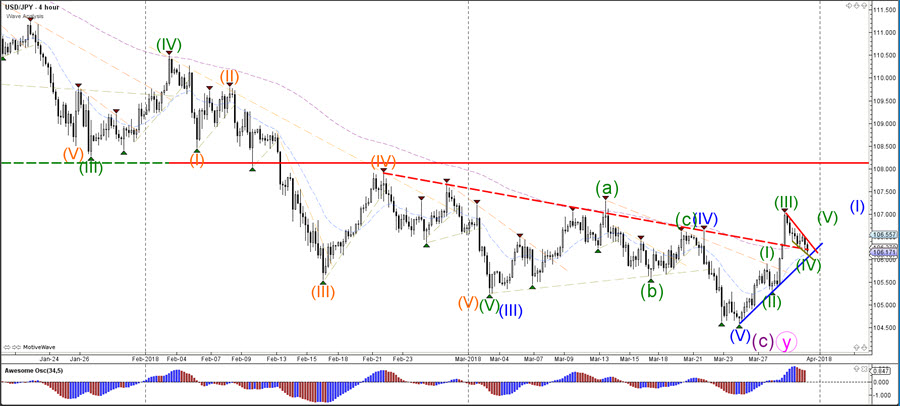
The USD/JPY bullish break above the resistance trend line (red) is making a pause. A bounce at support (blue) could indicate an uptrend continuation whereas a bearish break could indicate that price completed an ABC rather than 123 which could create more downside.
1 hour
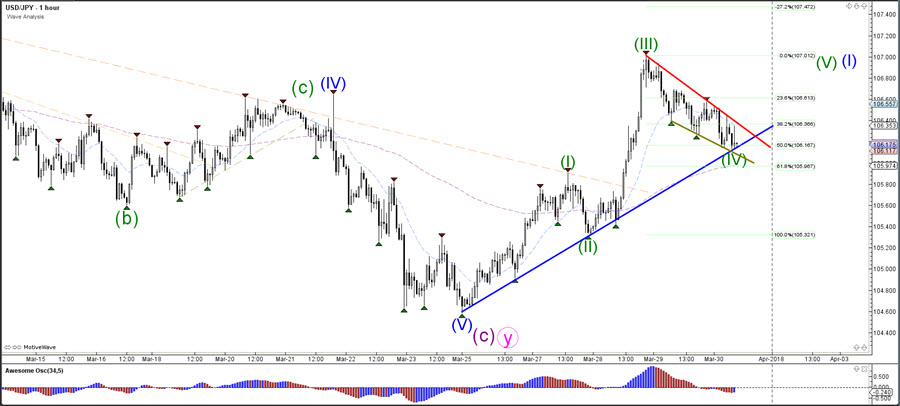
The USD/JPY could be building a wave 4 (green) as long as price stays above the support trend line (blue) and 61.8% Fib.
Good trading,
Chris Svorcik
Elite CurrenSea
.


Leave a Reply