? EUR/USD Bear Flag Pattern Retests Critical Fibs at 1.09 ?

Dear traders,
the EUR/USD is building a bear flag chart pattern back to the Fibonacci retracement levels of wave 4 vs 3. Will price respect the resistance zone?
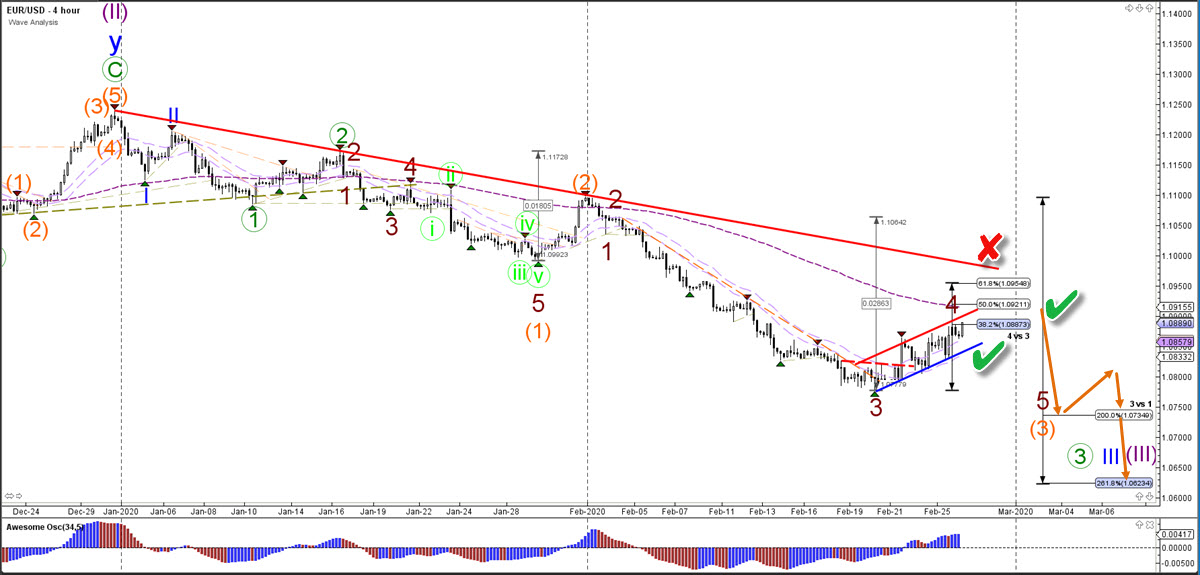
EUR/USD
4 hour
The EUR/USD is testing the Fibonacci resistance of wave 4 vs 3. A bearish bounce and breakout confirms (green checks) the end of the wave 4 (dark red) and the start of the wave 5 (dark red). A bullish break above 1.0950-1.10 invalidates (red x) the downtrend. A bearish continuation aims at the Fibonacci targets.
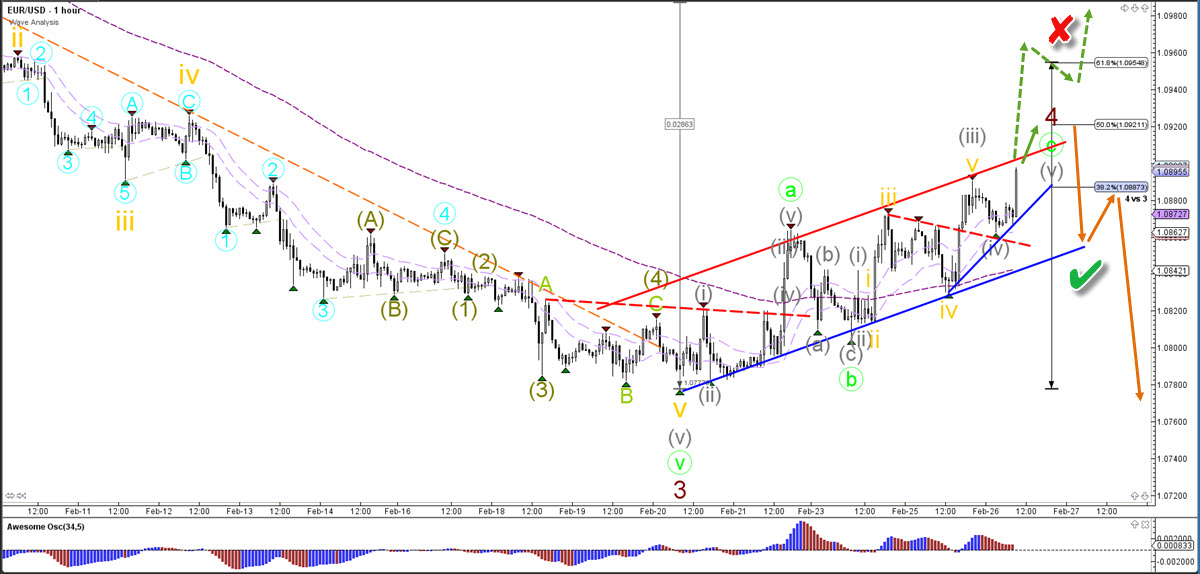
1 hour
The EUR/USD is showing strong bullish momentum at the moment. Price is likely to move up to the 50% Fib at 1.0920, which is the next key decision zone for a bullish breakout or bearish bounce. Strong momentum above the 61.8% Fib at 1.0950 invalidates (red x) the wave pattern. A bearish bounce and breakout confirms the wave 4 (dark red).
The analysis has been done with SWAT method (simple wave analysis and trading).
For more daily technical and wave analysis and updates, sign-up up to our newsletter.
Good trading,
Chris Svorcik
Elite CurrenSea


Leave a Reply