💥 McDonalds Bullish Reversal at 50% Fib of Wave 4 💥


Dear traders,
McDonalds (MCD) stocks have made a bullish reverse at the 50% Fibonacci retracement level. Does this indicate the end of the retracement and restart of the uptrend? The next earnings date is on 4 February 2021.
Price Charts and Technical Analysis
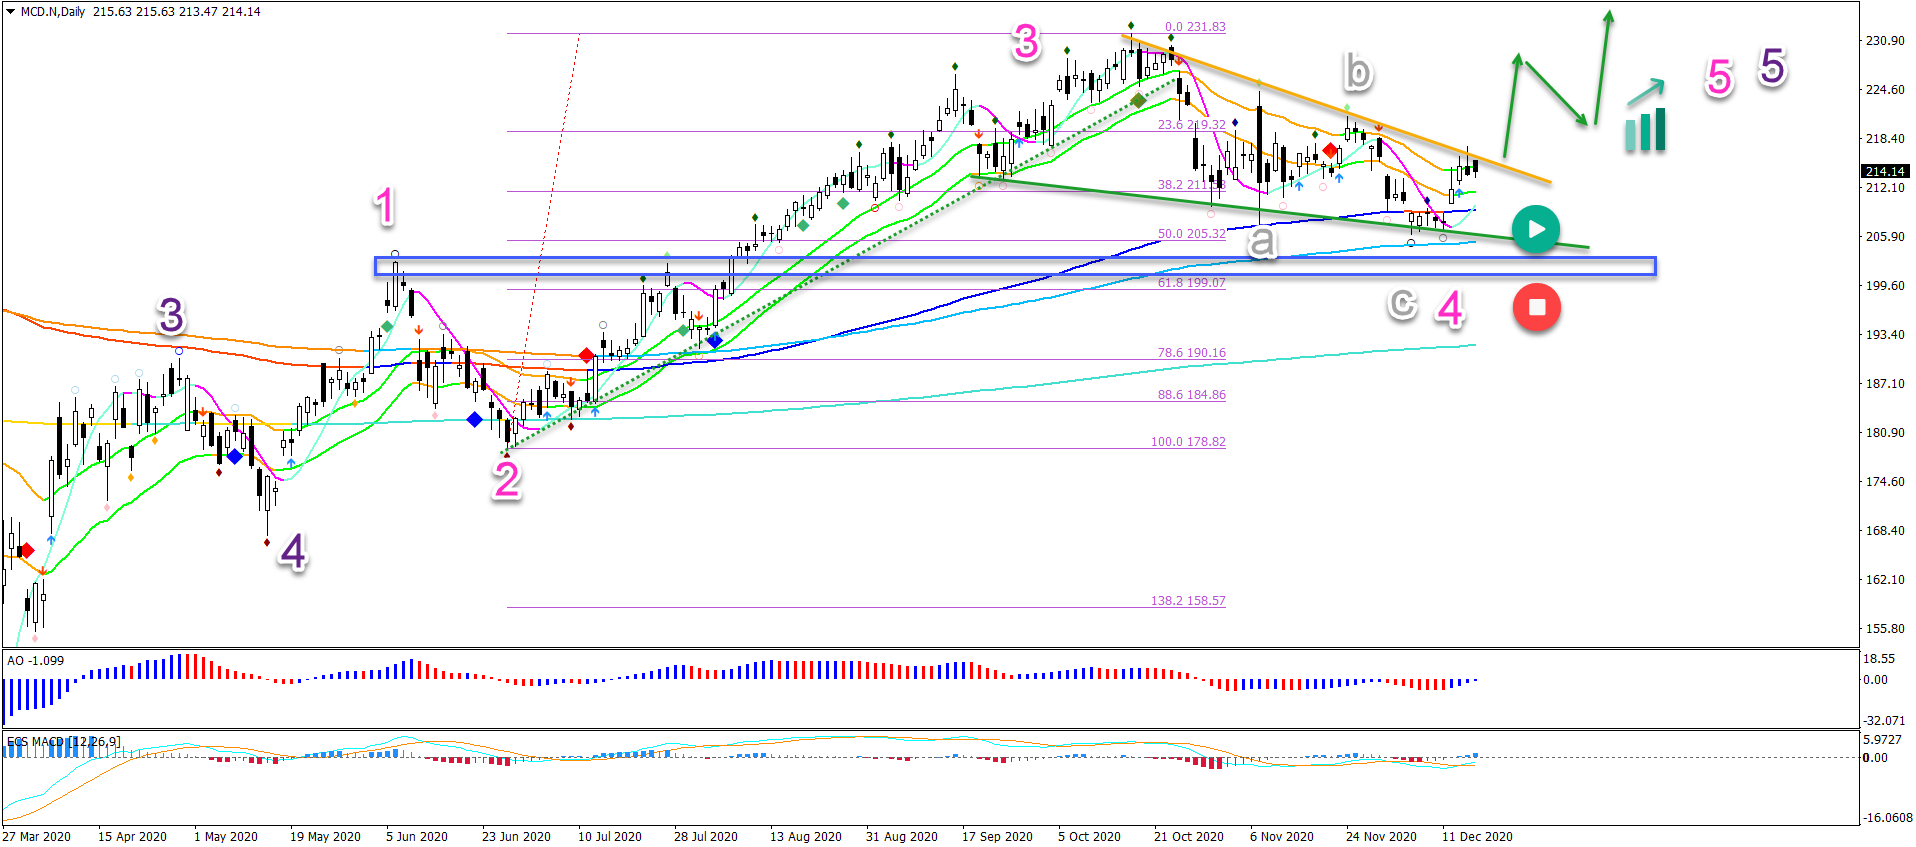
MCD seems to have completed a wave 4 (pink) pattern. This remains valid as long as price stays above the top of wave 1 (blue box). A break below it invalidates (red circle) our wave outlook.
A bullish breakout, on the other hand, confirms our bullish view. A wave 5 pattern could emerge above the resistance zone.
The main targets for upside are the -27.2% Fib at $246 and -61.8% Fib target at $264.
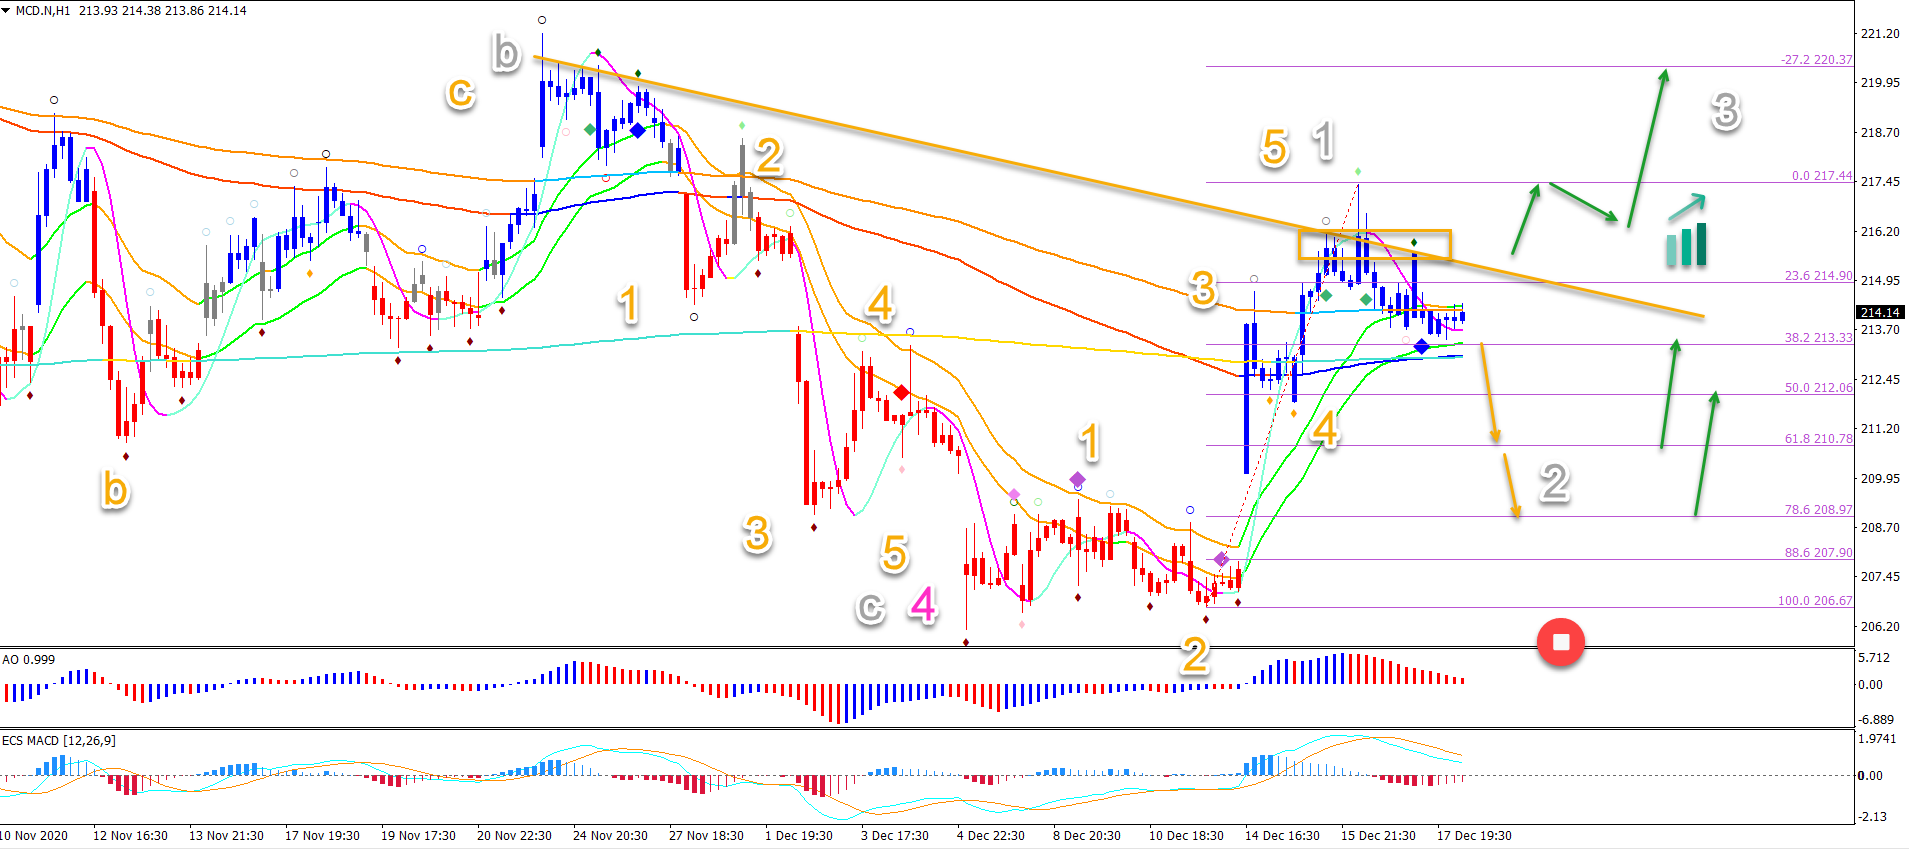
On the 1 hour chart, we see a first hint of a bullish reversal: the price action completed a 5 wave (orange) pattern. This seems to complete a wave 1 (grey).
- A bearish breakout could indicate a deeper retracement towards the Fibonacci retracement levels. They are expected to create a bounce or reversal.
- Only a break below the bottom and 100% Fibonacci level indicates an invalidation (red circle).
- A bullish breakout could indicate a new uptrend again.
- After the break, price action should make a bull flag to avoid any false breakouts
The analysis has been done with the indicators and template from the SWAT method (simple wave analysis and trading). For more daily technical and wave analysis and updates, sign-up to our newsletter.
Good trading,
Chris Svorcik


Leave a Reply