WTI Oil – Triangle in Progress ?? Bullish & Bearish Break Possible
Subscribe
Dear Traders,
WTI Oil continues to be in a corrective mode, but exciting trade opportunities lie around the corner nevertheless.
Today’s post will provide wave analysis for WTI and highlight potential trade setups.
Triangle In Progress
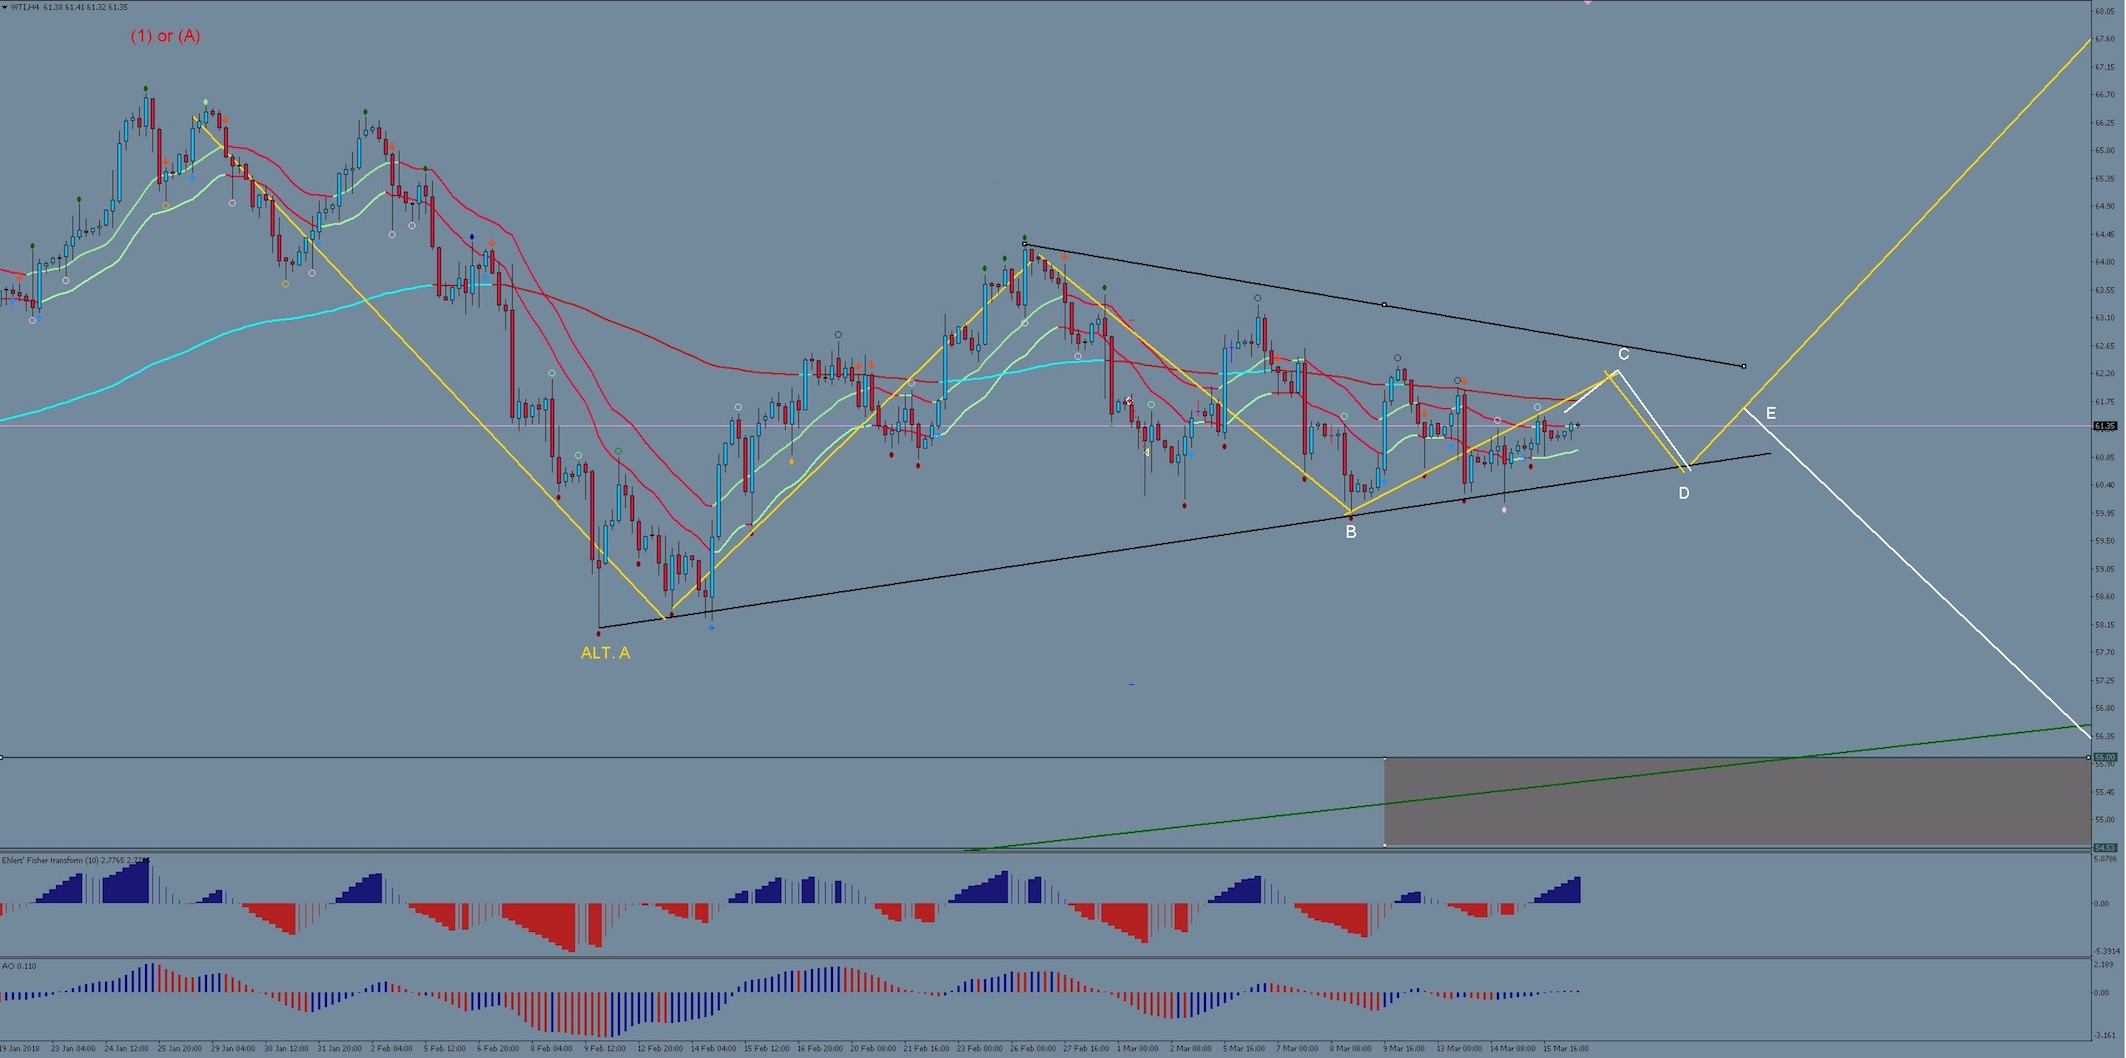
WTI is shaping up into a nice triangle pattern since the drop from its Jan 2018 high.
The possibility of a bullish or bearish break exist… depending on whether the initial drop from the high is counted as the 1st part of the triangle or not. The first drop is an impulse structure, which is still valid within triangle pattern rules.
Therefore waiting for a break and retest of the triangle trendlines is probably the best trading approach to follow… the reward potential is great in either direction.
Setups
A bearish break of the triangle will open the way for an impulse move down towards 56 – 54.50. This area is a POC consisting of the following elements:
- The top of the range from which price broke out of in November 2017.
- The support level of Wave 4 of a lower degree
- The 50% Fibonacci retracement level
- The weekly chart long-term moving average (144 EMA)
A bullish break should target at least 72.60 (-27.2% Fib extension), if we are witnessing a wave 4 currently. However the larger WTI wave structure leaves room for the current correction to be merely a wave 2, which would then suggest that the bullish break could target as high as 94 (161.8% fib extension). The same targets also apply if a bearish break occurs, only a bit later in time. In that case, price should bounce at the POC of 56 – 54.50 and then set northerly course towards to at least 72.60.
All the best along your trading journey
Hubert
Related articles
Existing partners
& sponsors


Existing partners
& sponsors
Leave a Reply