Weekly Waves 7 November: EUR/USD, Bitcoin and Gold
November 7, 2022
4 min read
Hi Traders,
Our weekly Elliott Wave analysis reviews the EUR/USD 4 hour chart, the XAU/USD 4 hour chart, and the Bitcoin 4 hour chart.
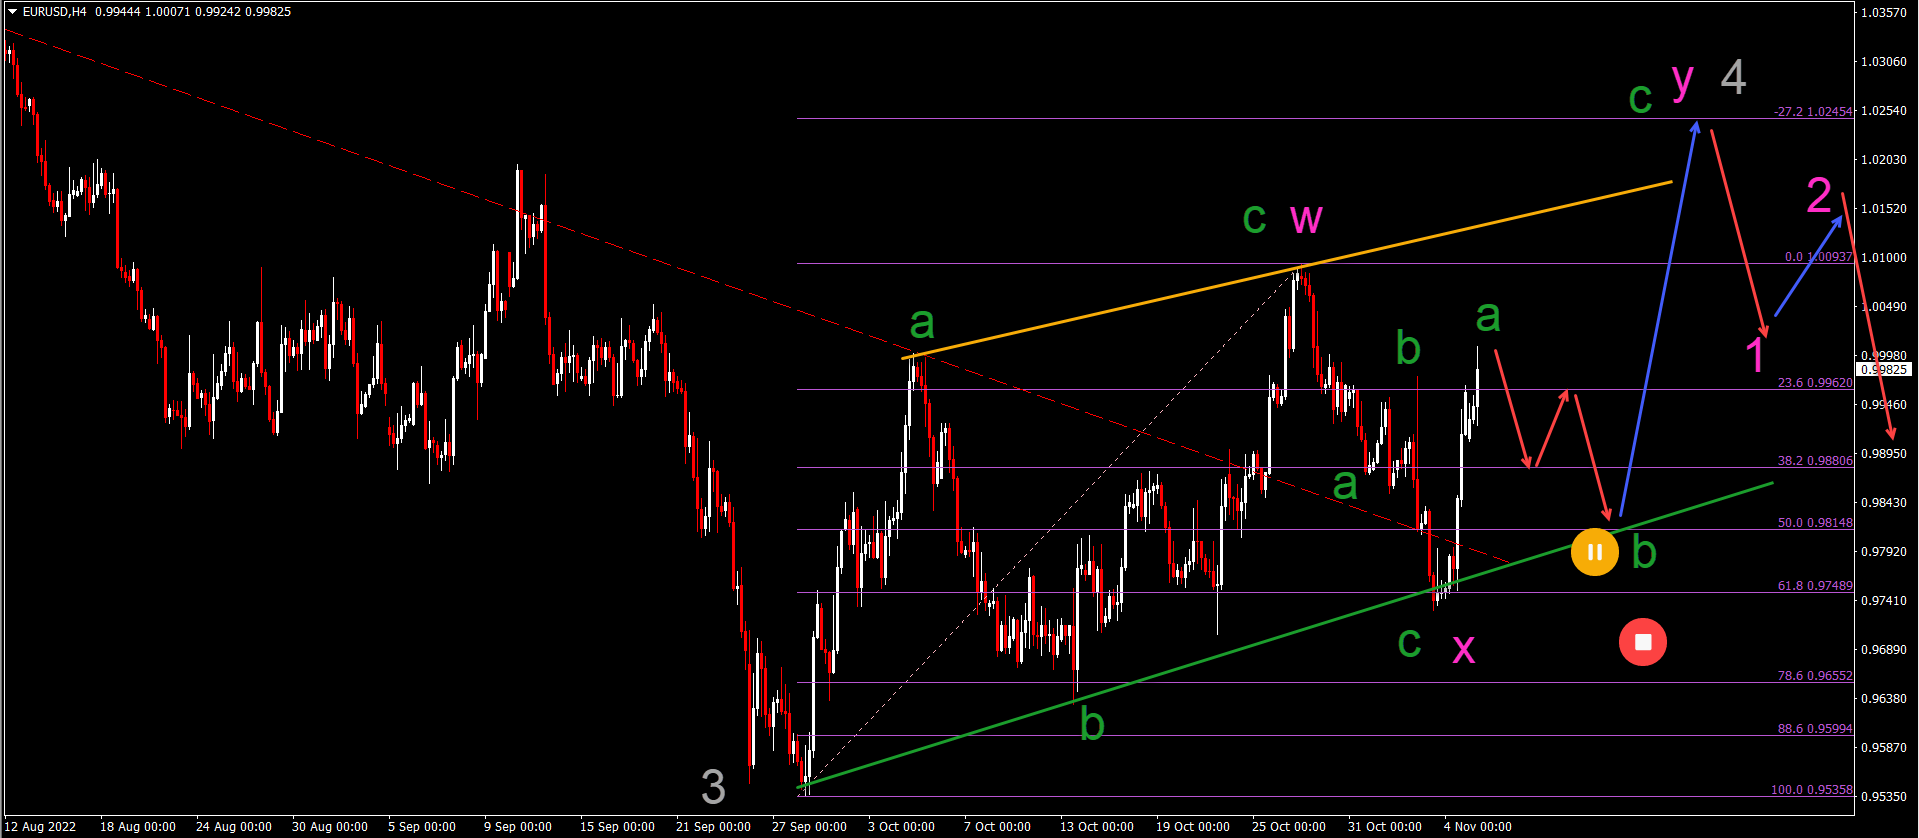
EUR/USD Bullish Bounce at 61.8% Fibonacci
The EUR/USD made a strong bullish bounce at the 61.8% Fibonacci retracement level:
- The EUR/USD bullish bounce at the golden ratio (61.8% Fib) increases the odds of a larger bullish retracement.
- The bullish correction could take place via a WXY (pink) correction.
- There was an ABC zigzag (green) within the wave W and X (pink) waves.
- There could be another ABC (green) within wave Y (pink) of wave 4 (gray).
- After the wave A (green) is finished, we expect a bearish ABC (red arrows) back to the support trend line (green) within the wave B (green).
- A bullish bounce (blue arrow) could take price up to the -27.2% target near 1.025.
ATHENA EA
#H1
#H4
#Time frames
Award Winning Momentum TradingPromo
Yearly Target:
220%
Risk/Reward:
0.36
Platforms:
MT4
Historical Drawdown:
30%
Min. Deposit:
50$
Asset Types:
Forex

Presented by
Chris Svorcik
Verified on:
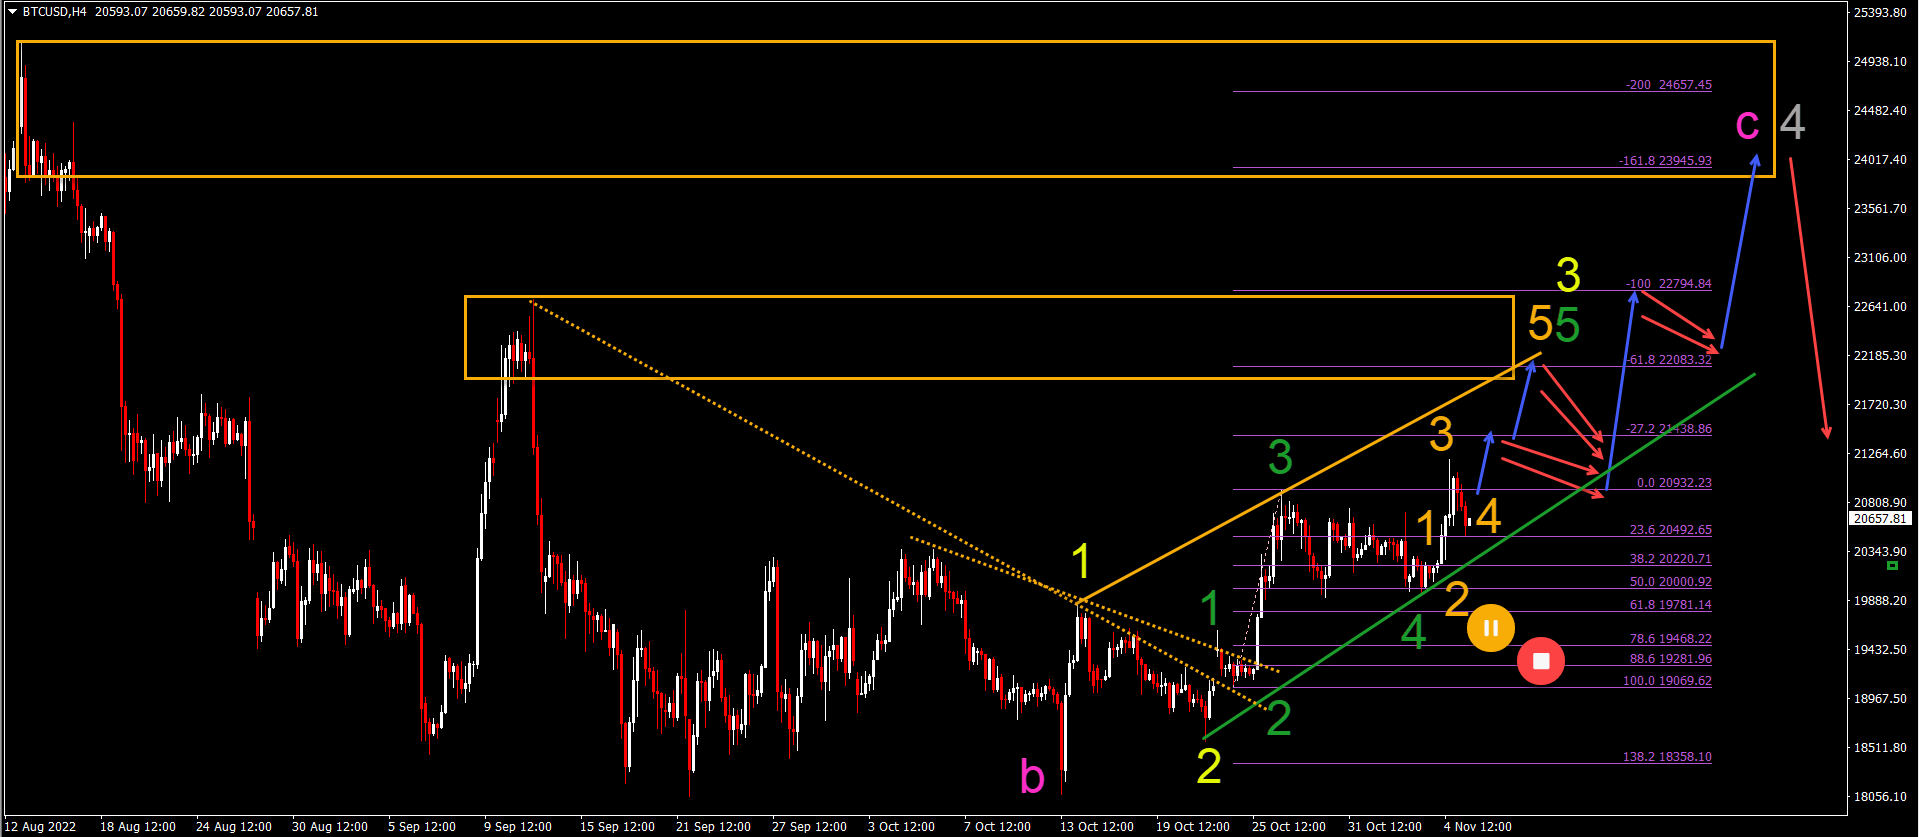
Bitcoin Uptrend after Bullish Breakout
Bitcoin (BTC/USD) is in a short-term bullish uptrend after breaking above the resistance trend lines (dotted orange):
- BTC/USD is in an uptrend channel with higher highs and higher lows.
- Bitcoin seems to have completed a wave 4 (green) recently.
- A move up within wave 5 (green) of wave 3 (yellow) is now expected.
- This remains valid as long as price action does not break below the support line (green) of the uptrend channel.
- There seems to be a 5 wave (orange) pattern within wave 3 (yellow) that could take price action up to the -27.2% and -61.8% Fibonacci targets.
- A retracement is then expected, followed by another push up.
- Ultimately price action should complete a wave C (pink) within wave 4 (gray).
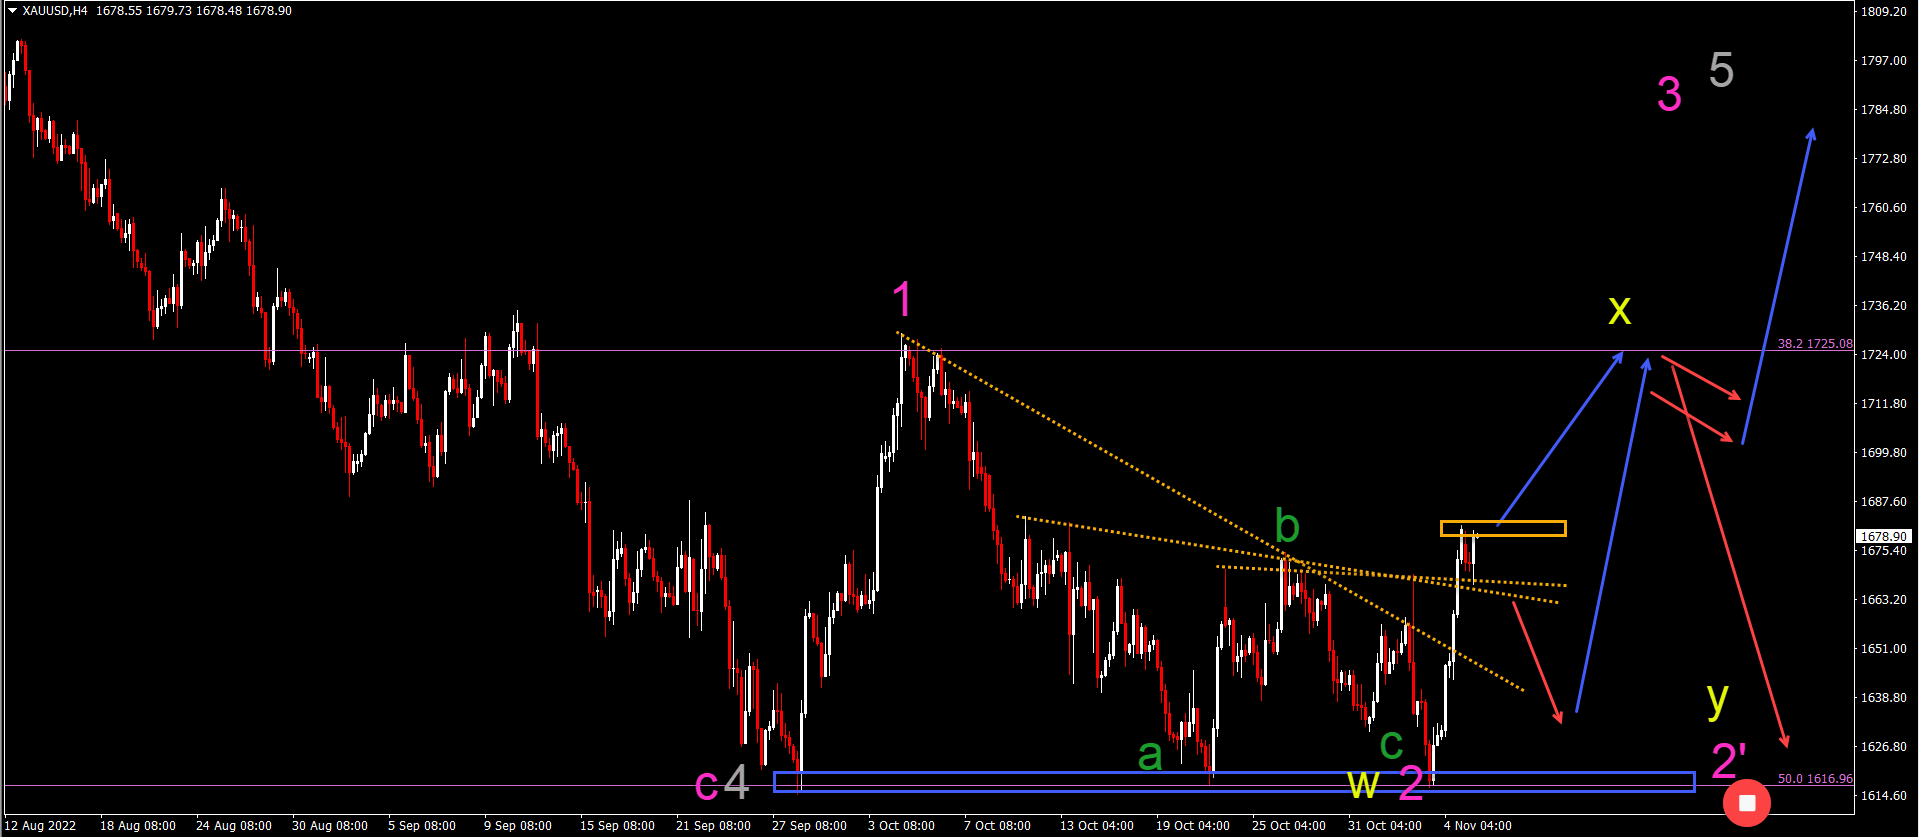
Gold Creates Double Bottom Pattern
Gold (XAU/USD) has bounced at the previous bottom without breaking it:
- The bullish bounce indicates a double bottom reversal chart pattern.
- The bounce however did not break below the previous bottom, which means that the wave 1-2 (pink) pattern is not invalid.
- A break below the bottom would invalid it.
- The breakout above the resistance trend lines (dotted orange) indicates a bullish swing.
- This bullish swing could either be part of 1) a wave 3 (pink) or 2) a larger WXY (yellow) within an extended wave 2’ (pink).
- The wave pattern will depend on the price reaction at the previous top.
Good trading,
Chris Svorcik


Leave a Reply