Weekly Waves 4 Apr: EUR/USD, Bitcoin and Gold
April 4, 2022
5 min read
Subscribe
Hi Traders,
our weekly Elliott Wave analysis reviews the EUR/USD daily chart, the Bitcoin crypto currency on the 4 hour chart, and XAU/USD on the 4 hour chart.
EUR/USD Indecision Zone Awaits Breakout
The EUR/USD is in a difficult position with strong support and resistance zones nearby. Let’s review:
- The EUR/USD support zone is very strong due to the 88.6% Fibonacci retracement level of the weekly chart.
- Price action has already made a bullish bounce at this 88.6% Fib, which could confirm a larger ABCDE triangle pattern on the weekly chart. The most recent low could be a wave D of that triangle pattern.
- However, price action is building a corrective and slow bullish price swing (gray box). This does not look like a strong bullish reversal.
- Therefore, price action will need to show its true intent. For the bulls that means by breaking above the resistance trend lines (orange). In that case, price action has completed wave C (pink) and is probably building an ABC (gray) upward (green arrows) within a wave E of the weekly triangle.
- But if price action breaks below (orange arrows) the support zone (blue box), then price action is back in a downtrend and price action is building a wave 3 (pink).

ATHENA EA
#H1
#H4
#Time frames
Award Winning Momentum TradingPromo
Yearly Target:
220%
Risk/Reward:
0.36
Platforms:
MT4
Historical Drawdown:
30%
Min. Deposit:
50$
Asset Types:
Forex

Presented by
Chris Svorcik
Verified on:
BTC/USD Building Bearish Pullback but Aiming at 50k
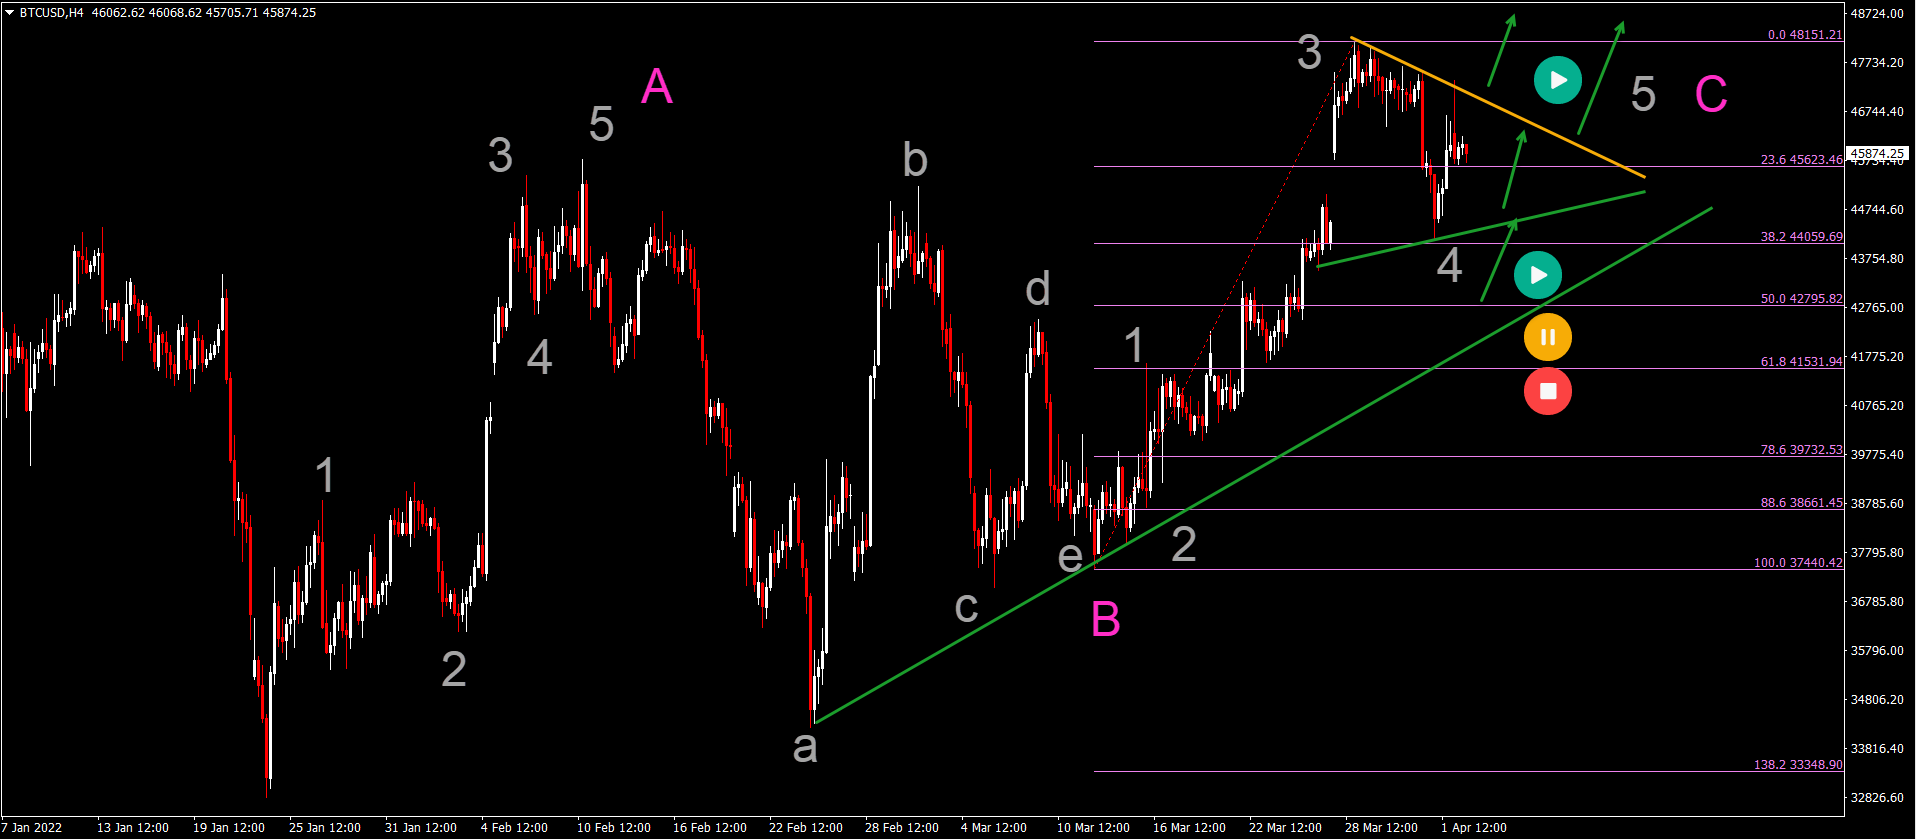
Bitcoin is building an ABC (pink) pattern as expected in our last Elliott Wave analysis:
- The ABCDE (gray) triangle pattern within wave B (pink) seems finished after the price action broker above the resistance and previous top.
- The current bullish swing is probably a wave C (pink).
- The current consolidation seems to be a wave 4 (gray) within the wave C (pink).
- This Elliott Wave outlook remains valid as long as price action remains above the 50% Fibonacci level.
- A break below the 50% Fib places it on hold and below the 61.8% invalidates it.
- A bullish bounce or breakout (green arrows) could confirm the bullish analysis.
- The main targets for the bullish price swing are 50-51k., 55k, 59-60k and 65k.
Gold Hesitation with Bullish Rebound
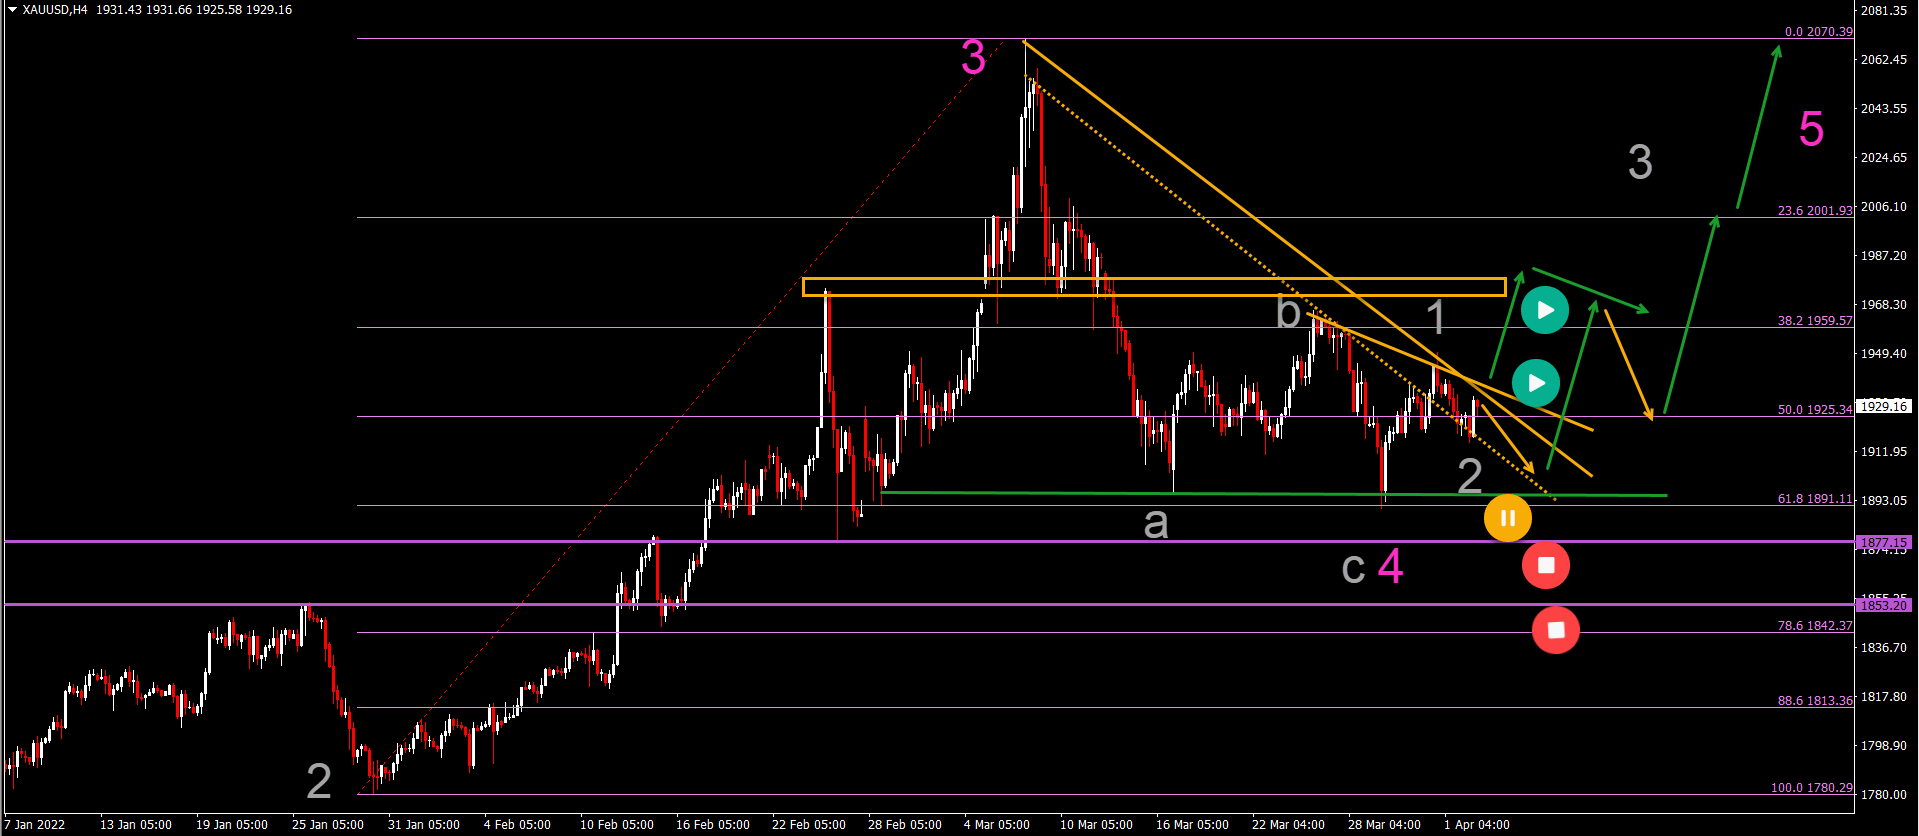
The XAU/USD (Gold) seems to be building a retracement after a strong surge upwards:
- The XAU/USD bullish price swing has been labelled as a wave 3 (pink) impulse.
- The retracement is therefore expected to be part of a wave 4 (pink).
- An ABC (grey) pattern seems completed within the wave 4 (pink) – although price action could always extend the correction via a WXY within wave 4. In that case, the ABC completed a wave W of the WXY.
- The wave 4 (pink) remains valid as long as price action stays above the horizontal support levels (purple).
- A bullish breakout (green arrows) above the resistance trend line (orange) could confirm the uptrend. The main targets are the previous resistance (orange box) and previous top.
Good trading,
Chris Svorcik


Leave a Reply