Weekly Waves 31 October: EUR/USD, GBP/USD and Bitcoin
October 31, 2022
4 min read
Hi Traders,
Our weekly Elliott Wave analysis reviews the EUR/USD 4 hour chart, the GBP/USD 4 hour chart, and the Bitcoin daily chart.
EUR/USD Bearish ABC After Bullish Rally
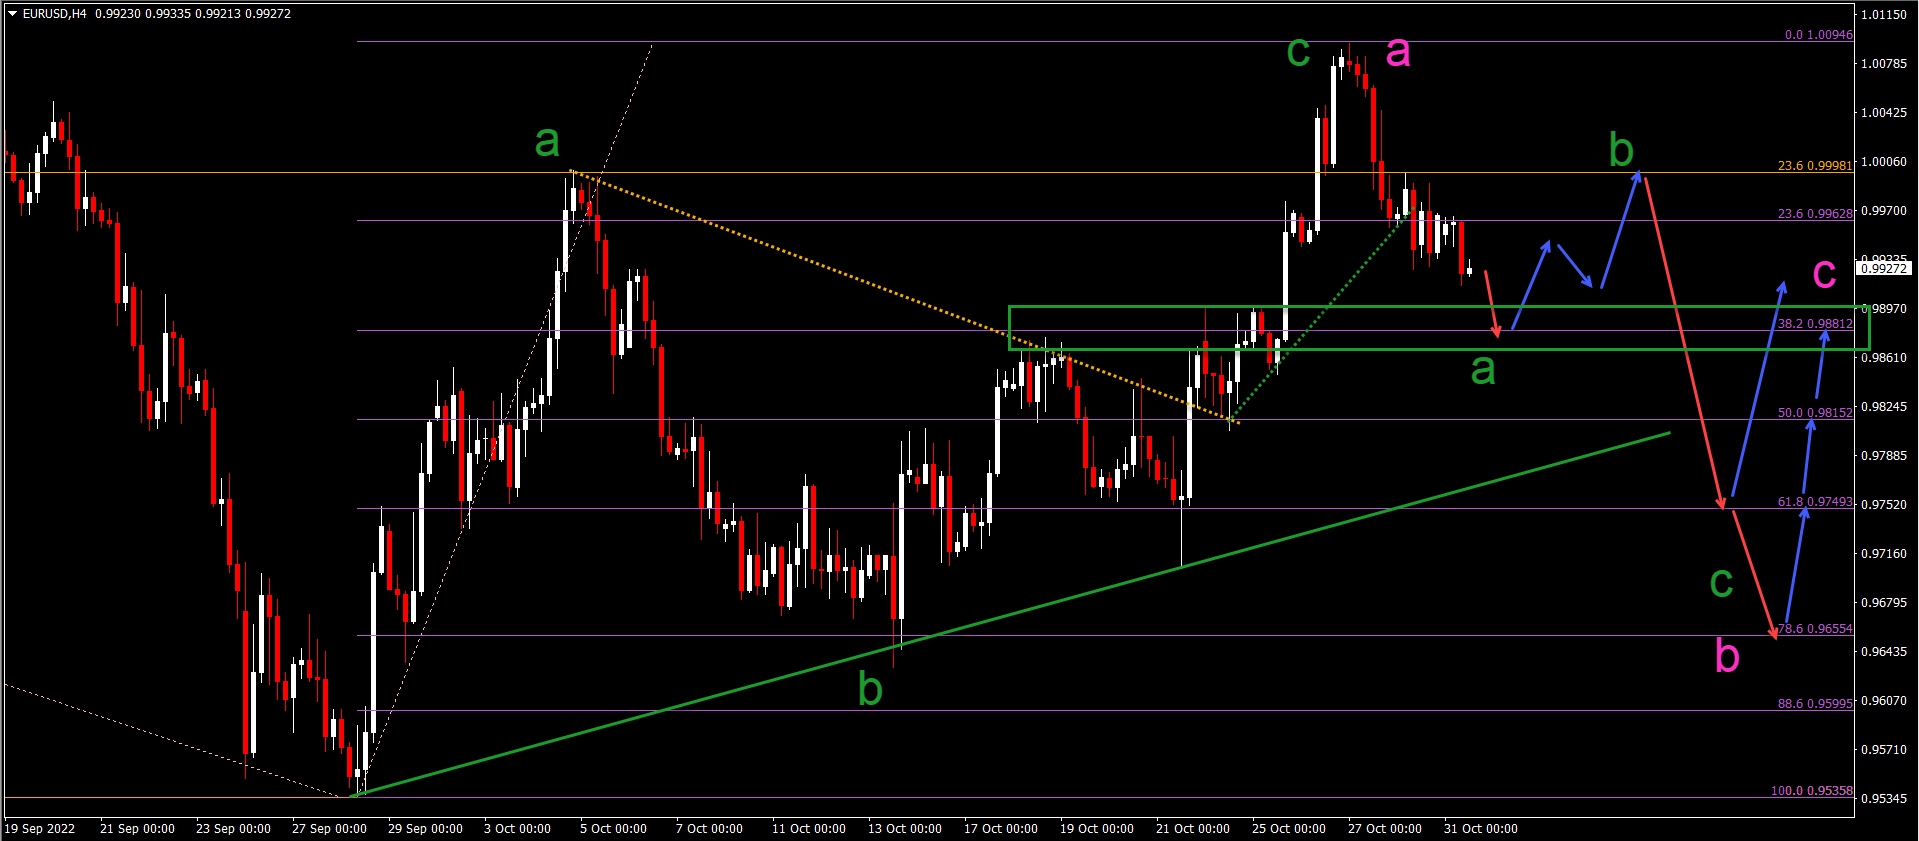
The EUR/USD made a bullish breakout rather than reaching the previous bottom last week as our analysis expected:
- The EUR/USD bullish breakout above the resistance trend line (dotted orange) sparked a bullish rally.
- This indicated the end of the wave B (green) and the start of the wave C (green).
- The bullish ABC (green) has probably completed a wave A (pink) of a larger ABC correction (pink) in wave 4.
- The wave A (pink) seems completed and the current bearish price swing is expected to start the wave A (green) within wave B (pink).
- The main target for wave A (green) is the 38.2% Fibonacci level.
- Later on, price action could drop lower to the deeper Fibonacci levels.
ATHENA EA
#H1
#H4
#Time frames
Award Winning Momentum TradingPromo
Yearly Target:
220%
Risk/Reward:
0.36
Platforms:
MT4
Historical Drawdown:
30%
Min. Deposit:
50$
Asset Types:
Forex

Presented by
Chris Svorcik
Verified on:
Bitcoin Breaks North of Key Resistance Trend Line
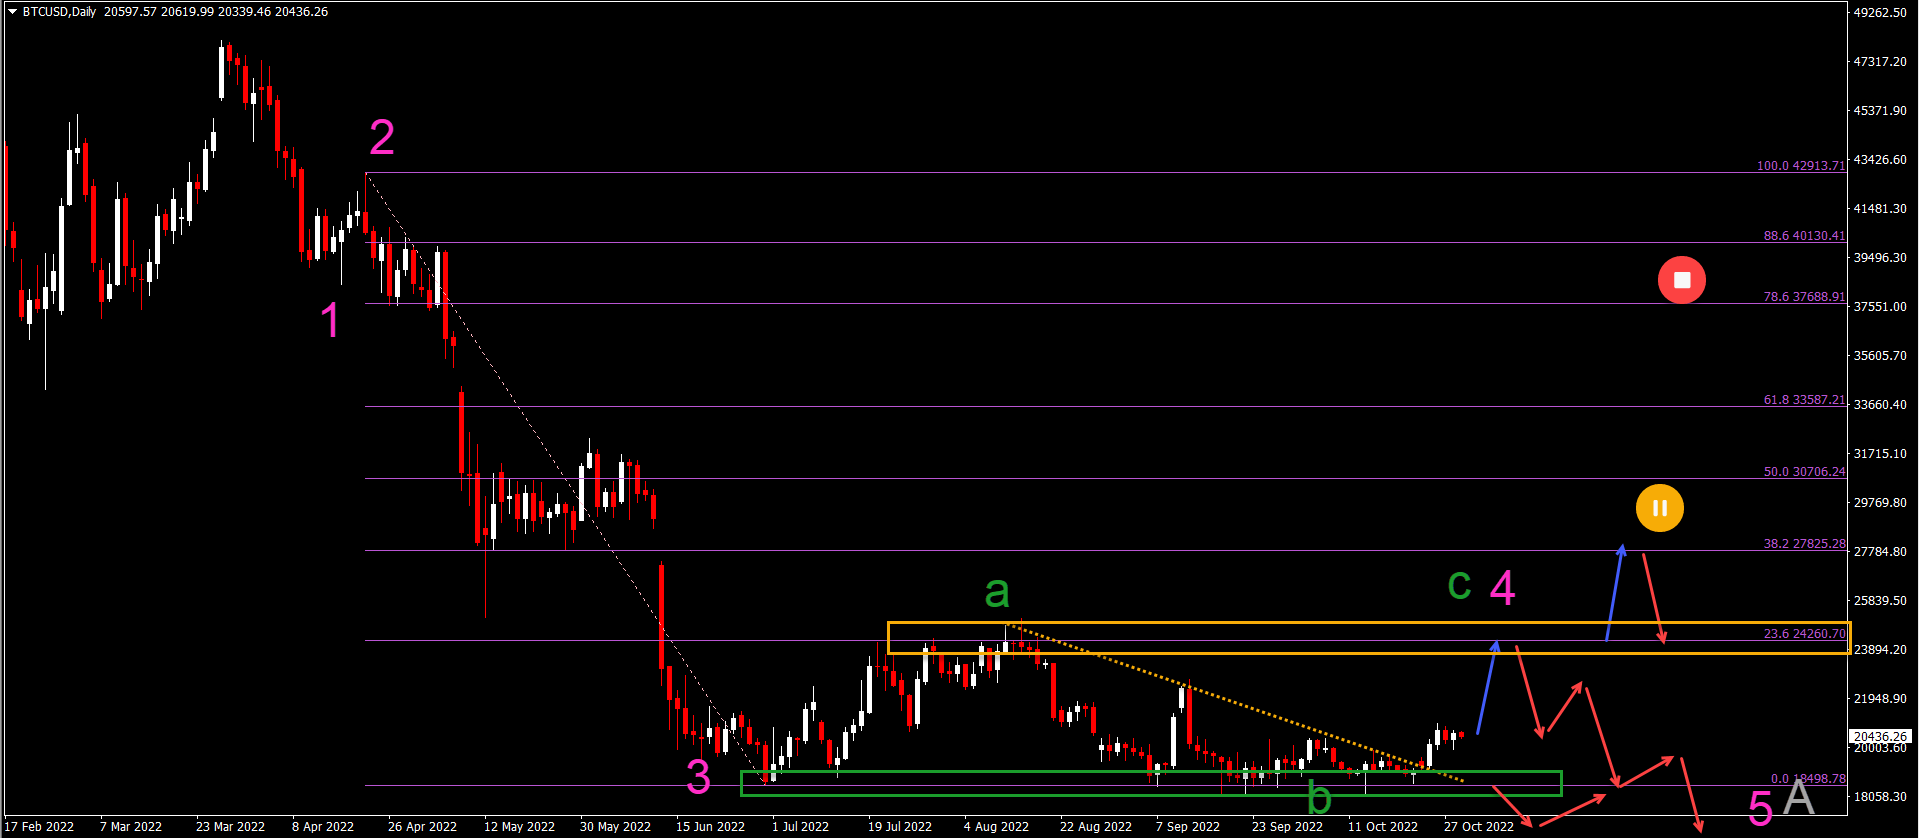
Bitcoin (BTC/USD) was unable to break below the previous bottoms and support zone (green box):
- BTC/USD made a bullish breakout above the resistance trend line (dotted orange).
- This breakout confirms the continuation of wave 4 (pink).
- A bullish ABC (green) pattern is unfolding within that wave 4 (pink).
- The breakout marks the end of wave B (green) and the start of wave C (green).
- The wave C (green) could test the previous top and 23.6% Fibonacci level.
- Price action could go as high as the 38.2% Fibonacci level within wave 4 (pink).
- A larger bullish retracement, however, would make the bearish Elliott Wave analysis unlikely.
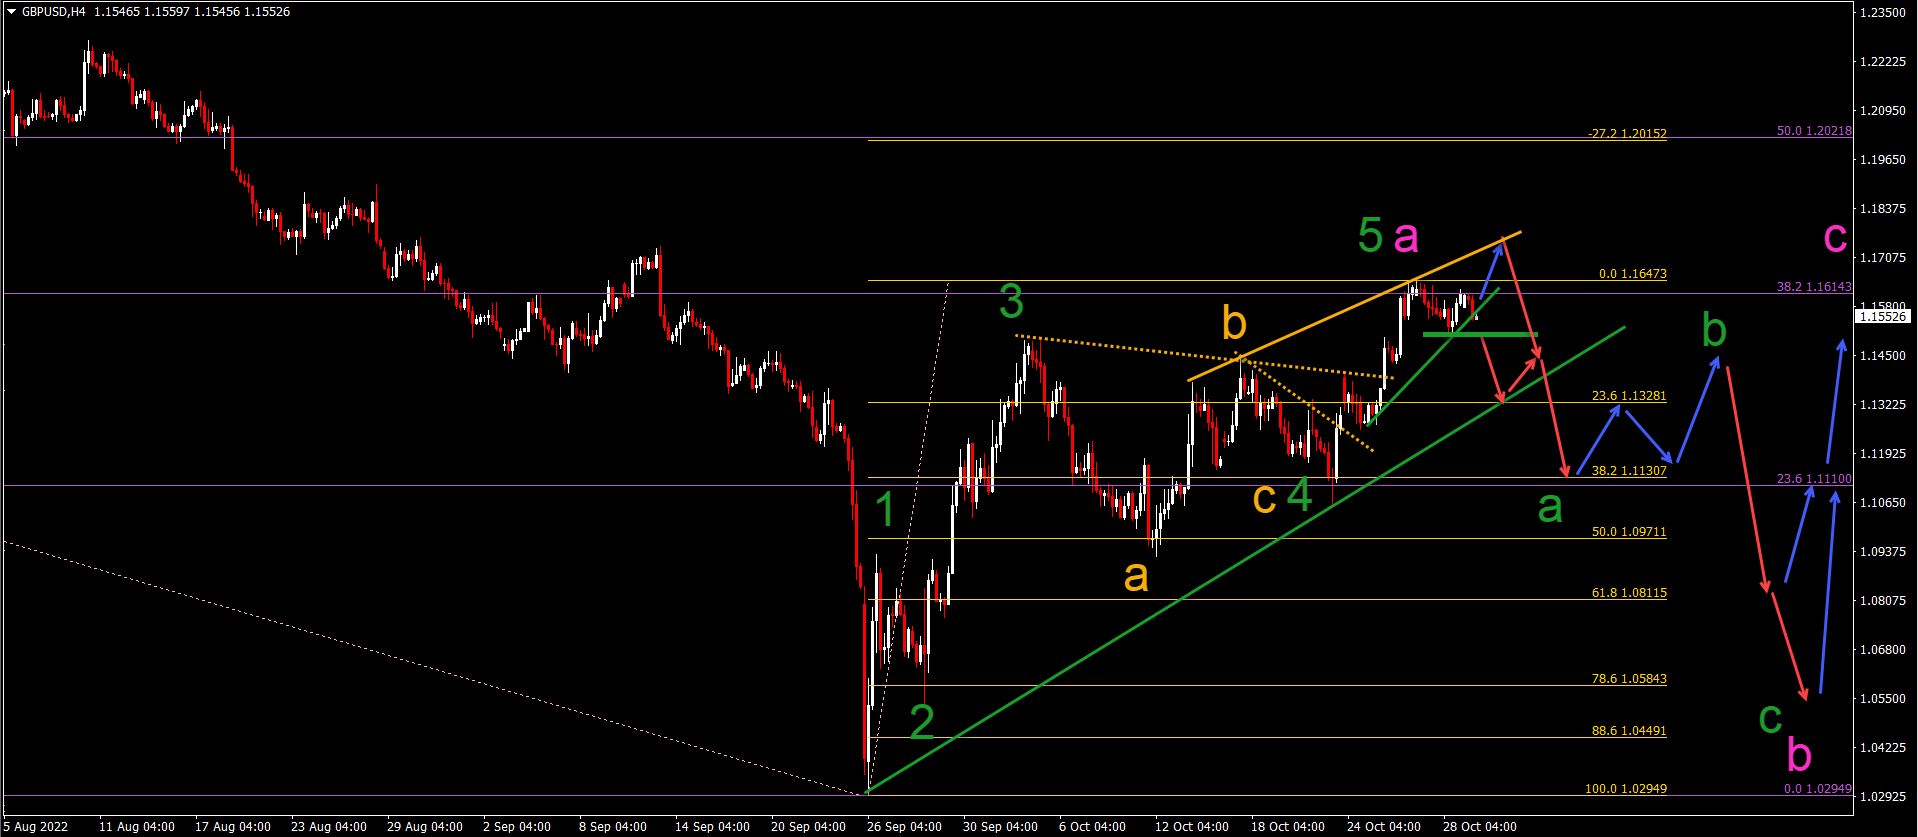
GBP/USD Facing Strong Resistance at 38.2% Fib
The GBP/USD is completing a bullish 5 wave pattern upwards (green):
- The GBP/USD seems to be losing its bullish momentum at the 38.2% Fib resistance (purple).
- A last push upward (blue arrow) could complete the rising wedge chart pattern.
- A bearish breakout (red arrow) below the support (green) line marks the end of the wave 5 (green) of wave A (pink) and the start of the bearish ABC (green) in wave B (pink).
- The bearish wave A (green) should reach the 38.2% Fibonacci level.
- The bearish wave C (green) should reach the 50-61.8% Fibonacci level of lower.
- Once the ABC (green) is completed in wave B (pink), a bullish wave C (pink) should take price action higher again in a larger wave 4.
Good trading,
Chris Svorcik


May I know what’s the wave structure for your wave 4(green) in your GbpUsd H4 chart? It doesn’t know like a regular flat, nor a running flat. Thanks.
Hi Terrence, I was thinking of a bullish ABC zigzag, which has 5 waves (up), 3 waves down, and 5 waves up. Lets see if it is indeed correct of course.
I appreciate the quick reply but I think you may have missed my point there. If you could refer to your Gbp/Usd H4 chart above, you will see that my question was regarding the bearish wave 4 (green) as indicated in the chart. Wondering what’s the wave structure for the bearish wave 4 (green) as it doesn’t look like a regular flat nor a running flat pattern to me. Hopefully you get what I mean and let me know the answer as I eagerly look forward to know what this bearish wave 4 (green) is. Thanks once again.
Ah sorry, misread your comment. It’s a wave 4 like I showed here: https://elitecurrensea.com/blog/forex/weekly-waves-3-oct-eurusd-gbpusd-ngas/ Normally waves 4 are not zigzags so next time I will probably change the wave outlook from the ABC zigzag to a regular flat for instance. Makes more sense indeed. Thanks for the comment!
I appreciate your reply but I think you may have missed my point there. If you could refer to your Gbp/Usd H4 chart above, I was asking what was the wave structure for the bearish wave 4 (green) as indicated in the chart. It doesn’t seem to look like a regular flat nor a running flat. I just can’t figure out what wave pattern it is. Hopefully you could tell me and I eagerly look forward to your answer. Thanks once again. (Somehow my previous message was being deleted and I have to re-enter this here again. 🙁 )
Ahhhh sorry Terrence, I was thinking of a running flat. But I agree that it’s far from ideal. The 3 waves in wave A look too impulsive. The 5 waves in wave C do not look much like 5 waves and are quite short. I had a running flat in mind but certainly not a great example. It’s a tricky one.
Thanks for replying. Yeah, I thought so too that the bearish wave 4 (green) could only be a running flat but it sure looks ugly to me as a running flat. Besides, a running flat requires its wave B (orange) to move beyond the start of its wave A (orange) and this isn’t the case for your bearish wave 4 (green) to be qualified as a running flat. So, my other alternative I have in mind is the whole wave movements after bullish wave 3 (green) could be an extended wave 5 in the making (replacing wave A (orange) as… Read more »
Another scenario I have in mind is to replace the bullish wave 5 (green) with your wave B (orange) and we have either a large bearish running flat(more likely) or an expanding flat in the making. Hope to hear your view on this as I still think your bearish wave 4 (green) can’t be a running flat. Thanks.
Hi Terrence, an expanded flat has a wave B going above the top indeed. A running flat does not and has wave C falling short of the bottom (this for bearish wave 4 in a bullish 5 wave). This is how I learned it at least. Your idea about wave 4 ending at wave A makes sense too indeed. I was thinking about that as well 🙂 so could be a good alternative.