Weekly Waves 28 Feb: EUR/USD, Bitcoin, and US30
February 28, 2022
5 min read
Subscribe
Hi Traders,
our weekly Elliott Wave analysis reviews the EUR/USD, the Bitcoin crypto currency, and the s
Unfortunately, the Russian invasion and war against Ukraine has started since our last update, with all the disaster that comes along with such horrific acts (check out how you can help Ukraine here). The financial markets will remain volatile as well, but we will do our best to explain our Elliott Wave analysis in this article.
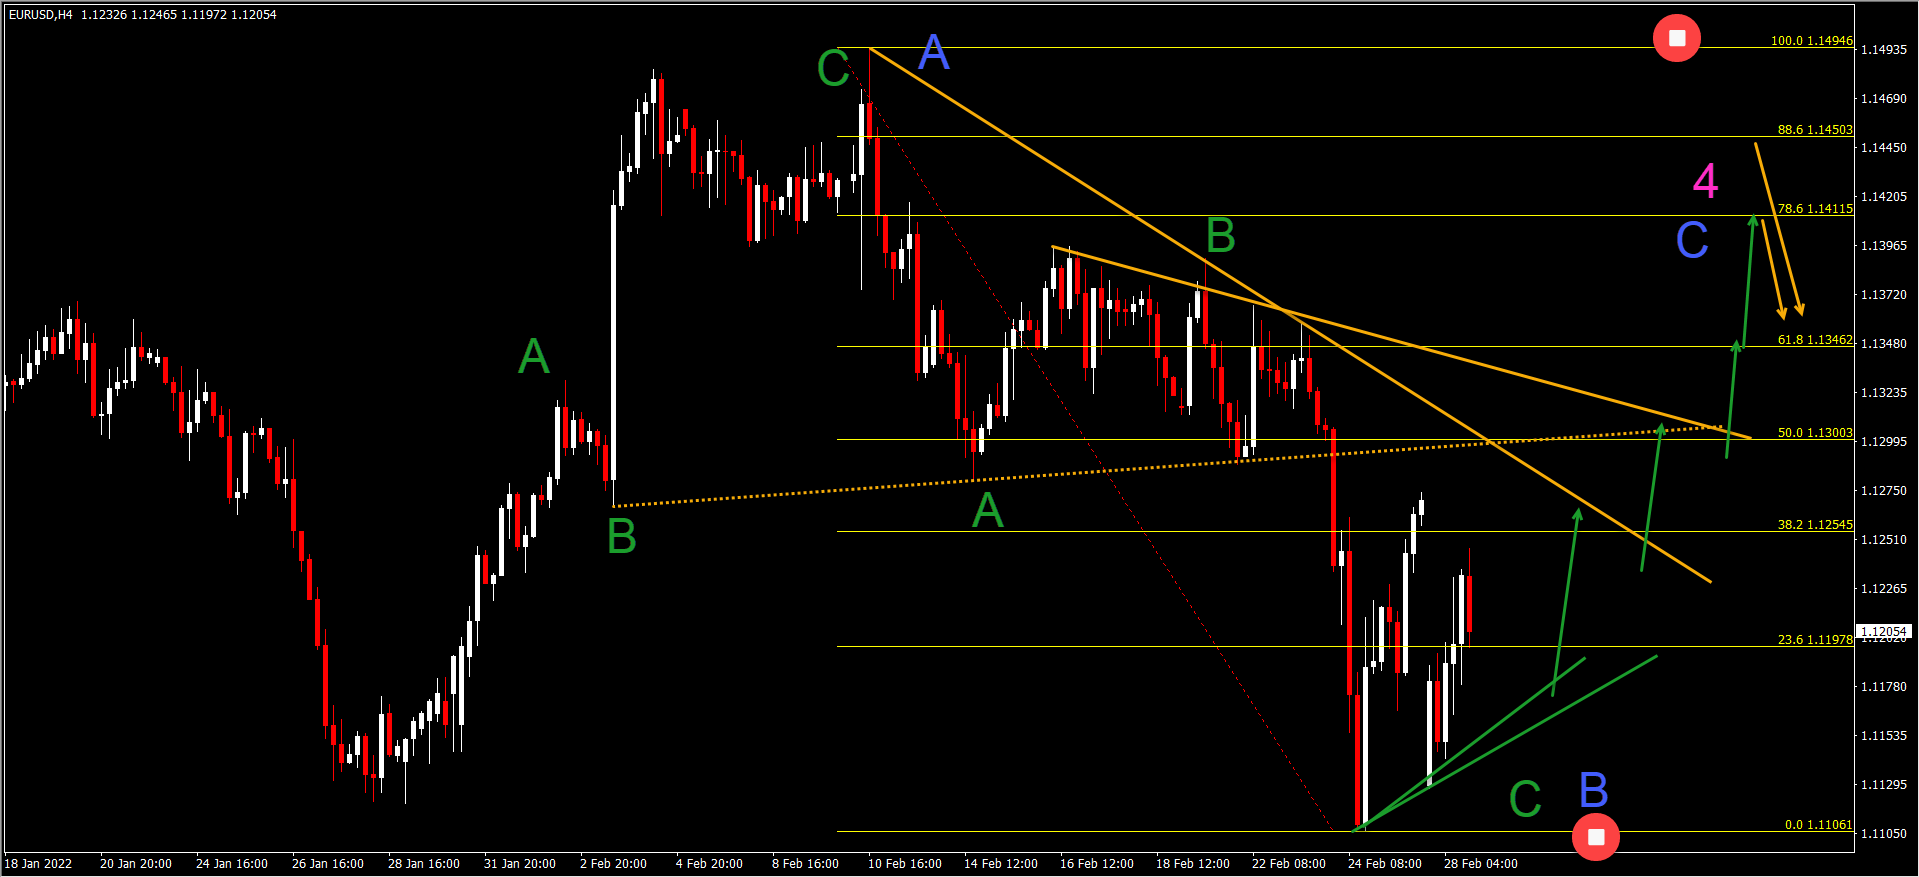
EUR/USD Breaks Bottom But Not ABC Pattern
The EUR/USD tested the previous bottom after a strong bearish decline:
- The bearish drop was strong and fell almost 400 pips from top to bottom.
- But the break of the previous bottom was only small. Is this a downtrend or part of a larger bullish correction?
- The current Elliott Wave analysis favours a bearish ABC (green) correction within the wave B (blue).
- The correction cannot be an ABCDE triangle pattern as we expected last week because price action broke below the bottom. But price action could still be part of a larger ABC correction.
- A bullish price swing would confirm the completion of a wave C (blue) within 4 (pink).
- To confirm the bullish swing, price action needs to break above the resistance (orange) trend lines.
- A break below the bottom indicates an immediate downtrend whereas a break above the top could indicate the end of a downtrend.
ATHENA EA
#H1
#H4
#Time frames
Award Winning Momentum TradingPromo
Yearly Target:
220%
Risk/Reward:
0.36
Platforms:
MT4
Historical Drawdown:
30%
Min. Deposit:
50$
Asset Types:
Forex

Presented by
Chris Svorcik
Verified on:
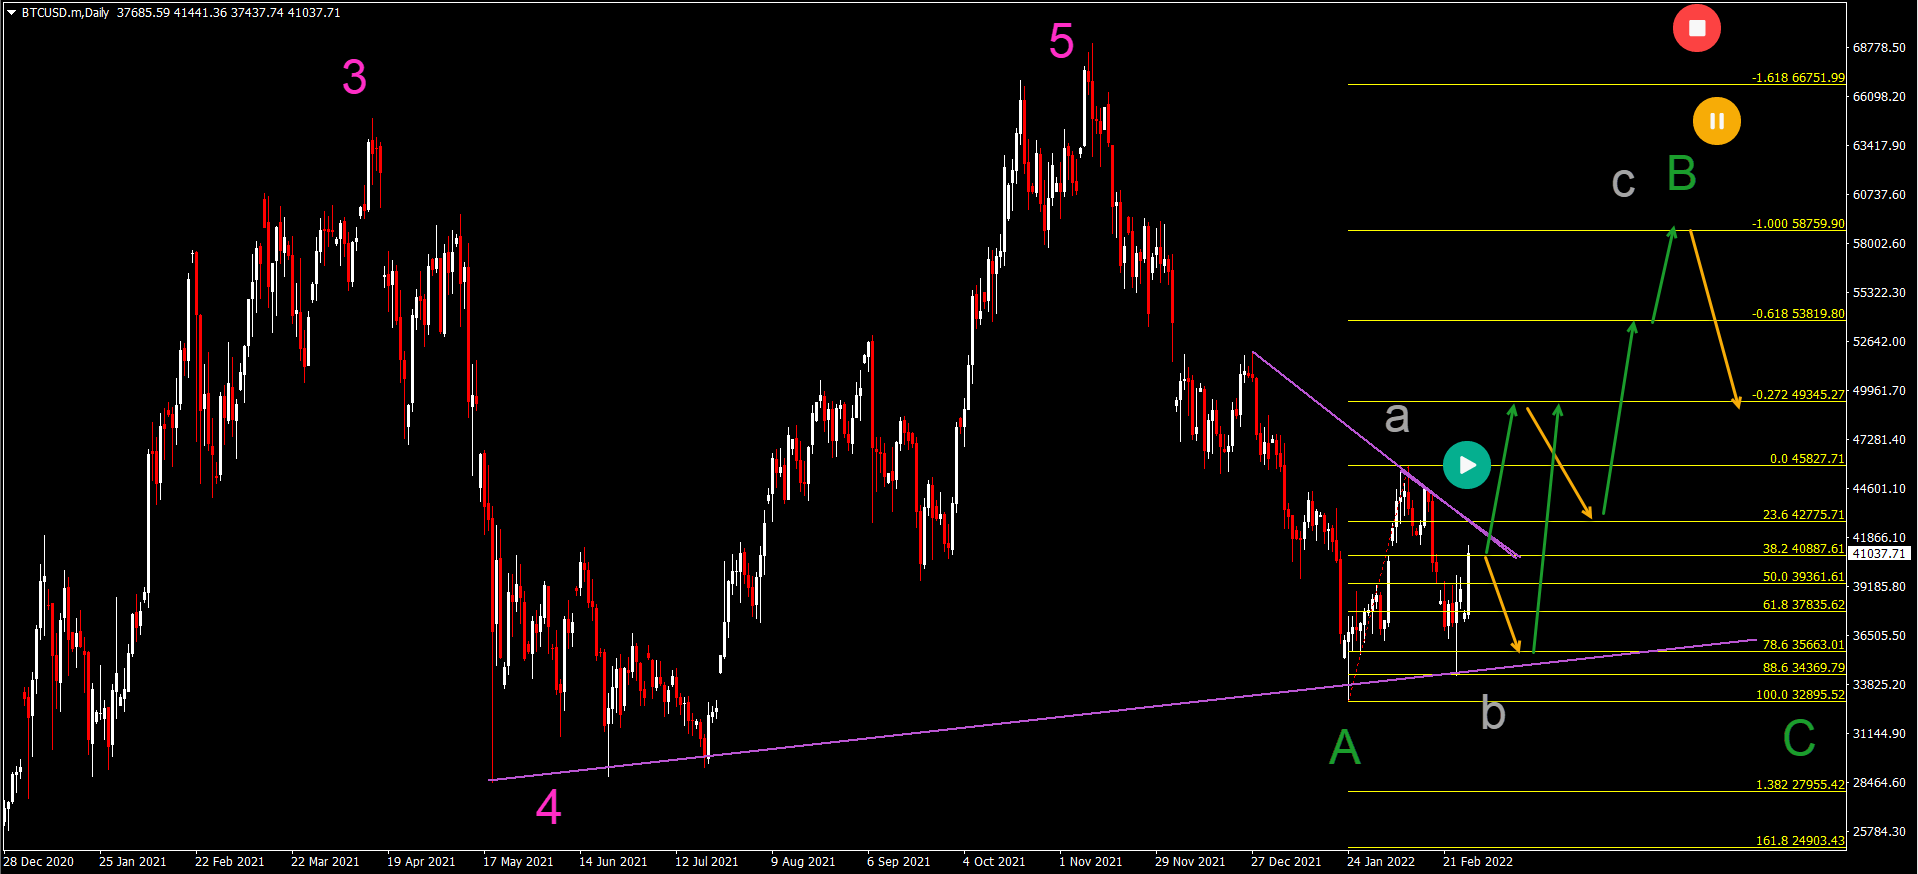
BTC/USD Bullish Bounce at 88.6% Fibonacci Level
The Bitcoin crypto pair (BTC/USD) failed to break the bottom as expected. Here is what that means for our Elliott Wave analysis:
- Price action tested the Fibonacci levels and previous bottom but failed to push below the key support zone.
- Price action ultimately bounced at the 88.6% Fibonacci retracement level.
- The bullish bounce has been marked as a wave B (gray) after price action completed a bullish wave A (gray).
- A break above the resistance trend line (purple) could indicate a short-term uptrend (green arrows).
- The main targets are the Fibonacci targets where a bearish bounce could emerge (orange arrows).
- At the Fibonacci targets, price action could complete the wave B (green) and make a bearish bounce (orange arrow) for wave C (green).
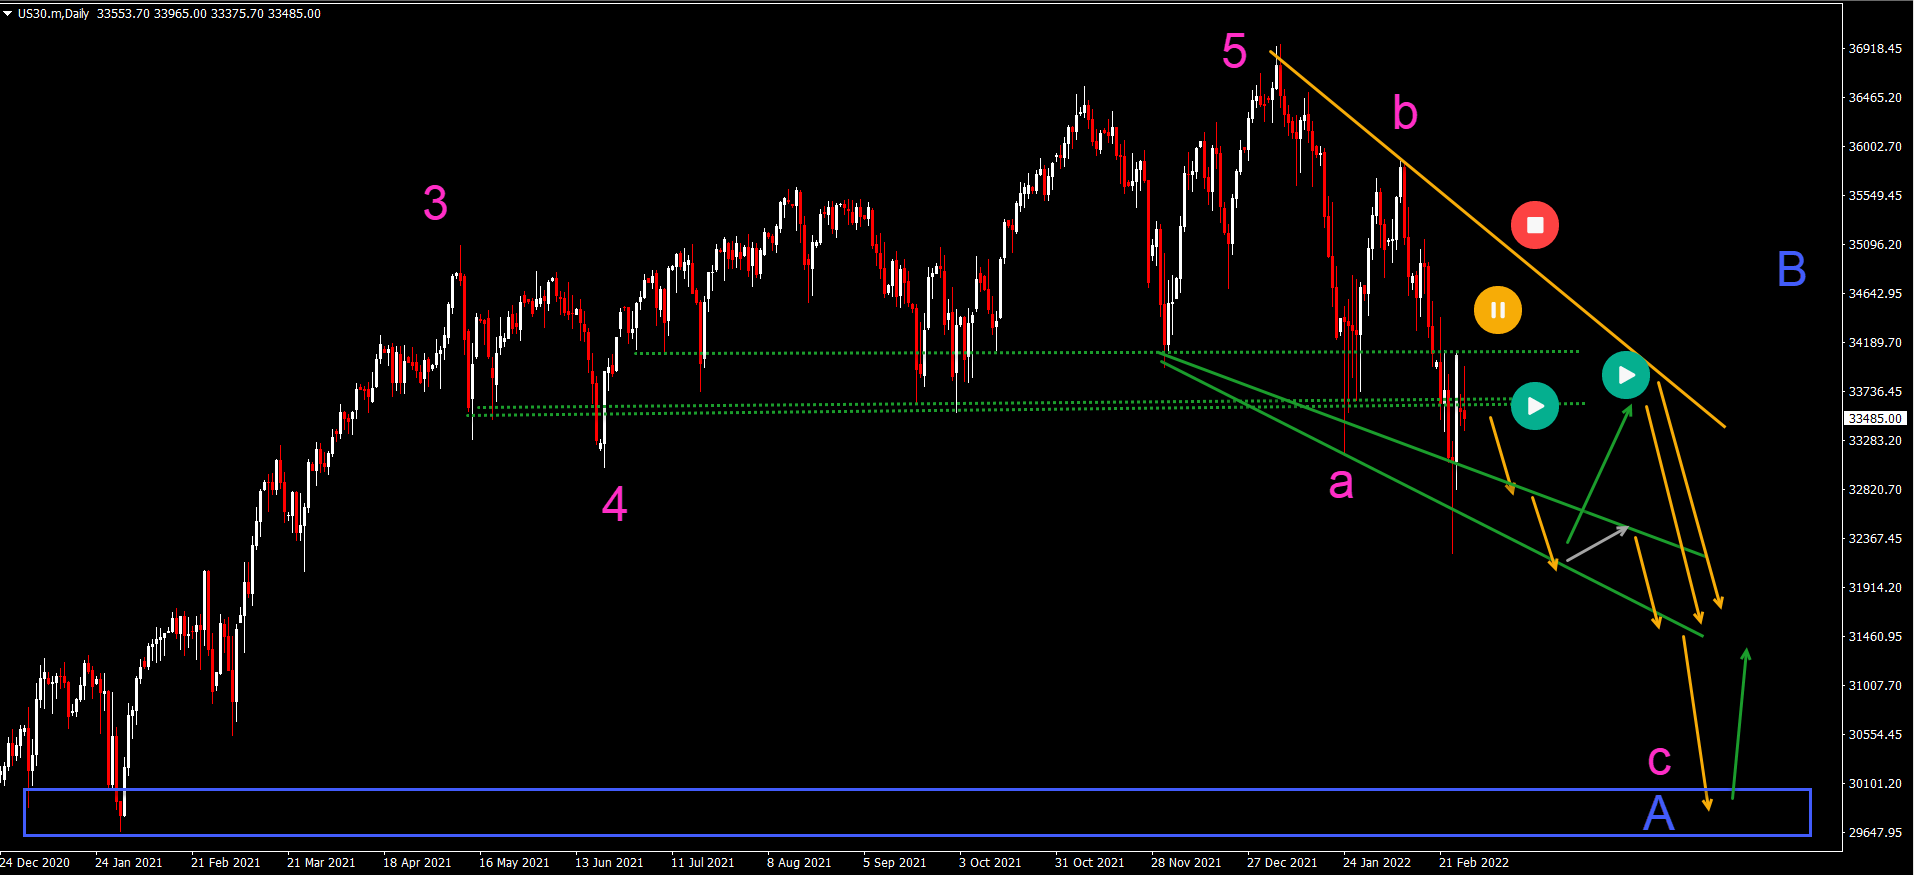
US30 Breaks Bottom and Starts Downtrend
The US30 has confirmed lower lows and lower highs now. Let’s review:
- The US30 stock market did not make any bullish bounce. Instead, price action made a bearish break below the key support zone (dotted lines).
- The bearish break could indicate a further decline of the downtrend (orange arrows).
- Price action could test the support trend line again.
- A bullish retracement could take place to test the resistance levels but eventually, a lower low and test of the round 30,000 level could take place.
- A bullish bounce (green arrow) at that support zone (blue box) is expected.
- A break above the resistance line (orange) could indicate a failure of the downtrend.
Good trading,
Chris Svorcik


Leave a Reply