Weekly Waves 25 Jan: EUR/USD, Bitcoin, and US 30
Subscribe
Hi Traders,
our weekly analysis on Elliott Waves takes a close look at the EUR/USD, the Bitcoin crypto currency, and the US30 stock market.
Our Elliott Wave outlook indicates a downtrend continuation on the EUR/USD and the end of a bearish 5 wave pattern on both BTC/USD and the US30 stock market.
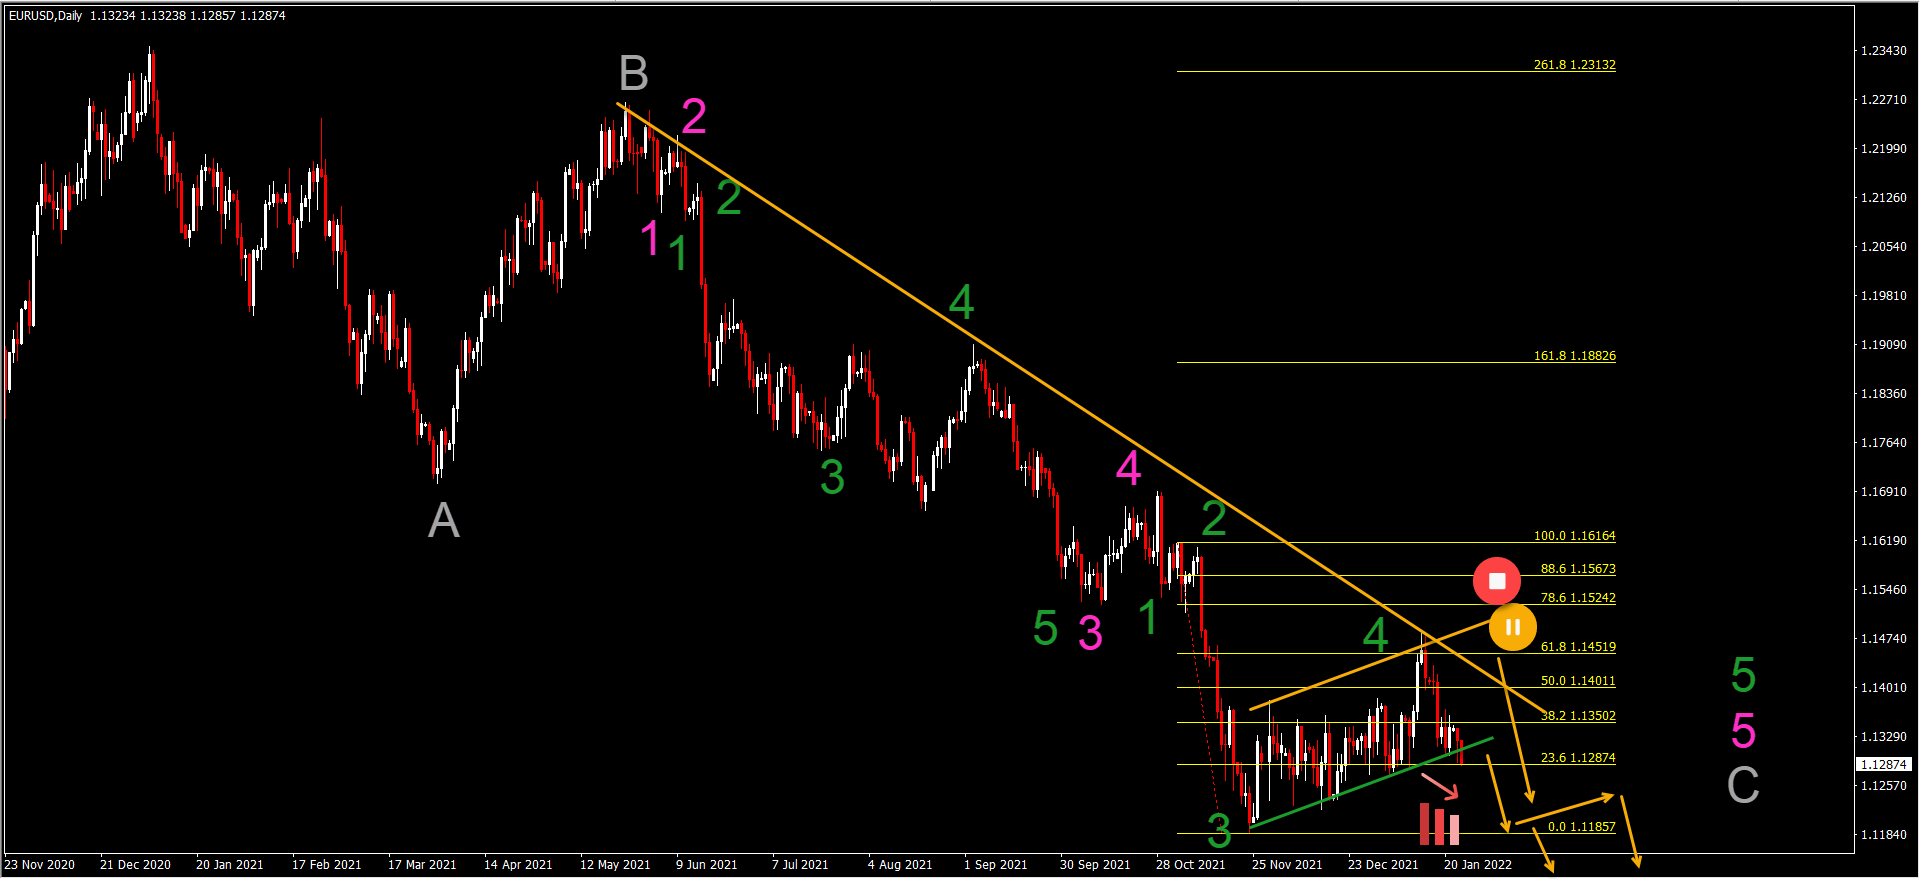
EUR/USD Retraces and Bounces at 61.8% Fib Resistance
The EUR/USD failed to make a bearish breakout below the bear flag chart pattern in the past 2 weeks. But now price action has made a bearish bounce at the 61.8% Fibonacci level and is retesting the support line again.
- This time around, a bearish breakout seems likely. A daily candle close below the support trend line (green) would confirm the break.
- The main target is the round level at 1.10. The bearish price swing could complete a wave 5 within wave 5 of wave C.
- An unexpected bullish break above the 61.8% Fibonacci resistance would place this bear flag pattern on hold whereas a strong bullish move invalidates it (red circle).
- The EUR/USD seems to be building an ABC (grey) pattern within a larger triangle pattern.
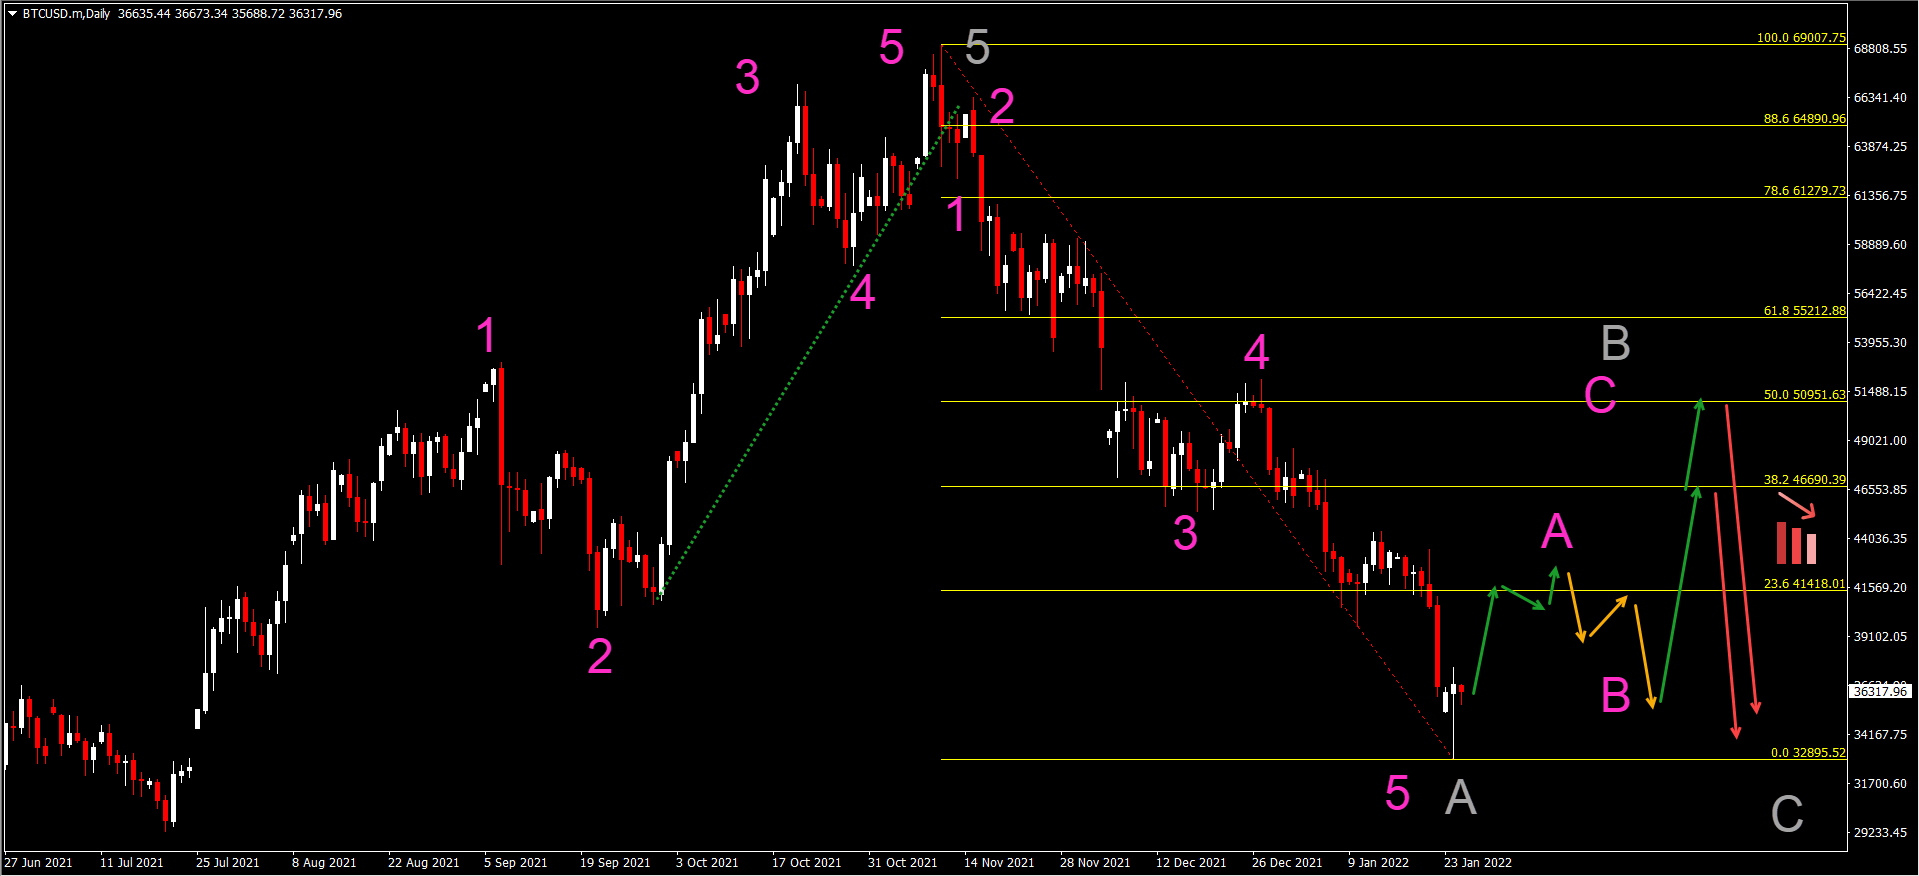
BTC/USD Finished Bearish Wave A
The Bitcoin crypto pair (BTC/USD) has seen some hard hits in its price during recent weeks. Can it fall further?
- The short answer is yes. The uptrend seems over and a strong and long bearish correction is expected according to our current Elliott Wave analysis.
- However, a 5 wave bearish pattern seems to be completed. The bullish pinbar candlestick pattern could confirm a bullish reversal.
- If price action does complete the bearish price swing, then price action has completed 5 waves (pink) in wave A (grey).
- The next price swing should be an ABC (pink) pattern in the wave B (grey). After the ABC is completed, the wave C (grey) down should resume.
- The main resistance levels of the wave B (grey) correspond to the 38.2% and 50% Fibonacci levels.
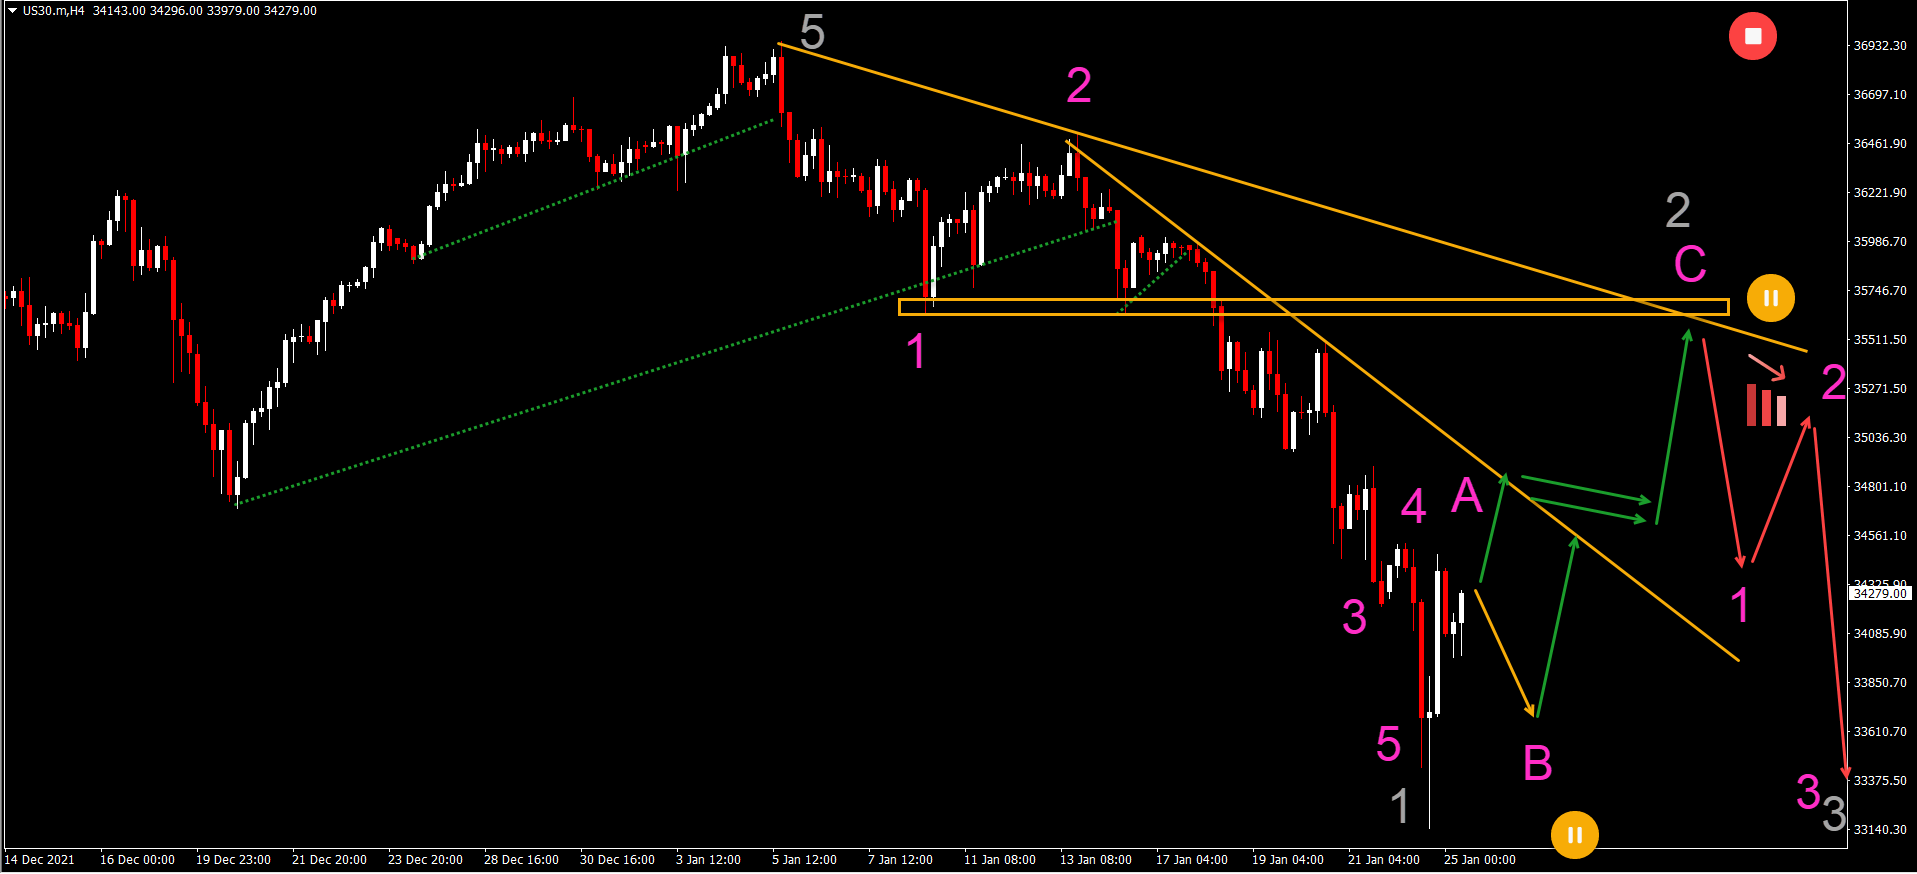
US30 Also Shows 5 Bearish Waves
Bitcoin seems to be highly correlated to the stock market. Many of the waves are the same and the US30 also is showing a completed 5 wave pattern in a wave 1 (or A) reversal:
- 5 waves (pink) seem completed in wave 1 (grey) or wave A.
- A bullish ABC (pink) is expected in wave B (grey).
- A bearish bounce at the resistance should end wave 2 and start wave C (grey).
- A break below the bottom indicates a continued downtrend whereas a break above the resistance could indicate bullish strength.
Good trading,
Chris Svorcik


Leave a Reply