Weekly Waves 19 December: EUR/USD, US30 and Bitcoin
December 19, 2022
4 min read
Hi Traders,
Our weekly Elliott Wave analysis reviews the EUR/USD daily chart, the US30 weekly chart, and the Bitcoin weekly chart.
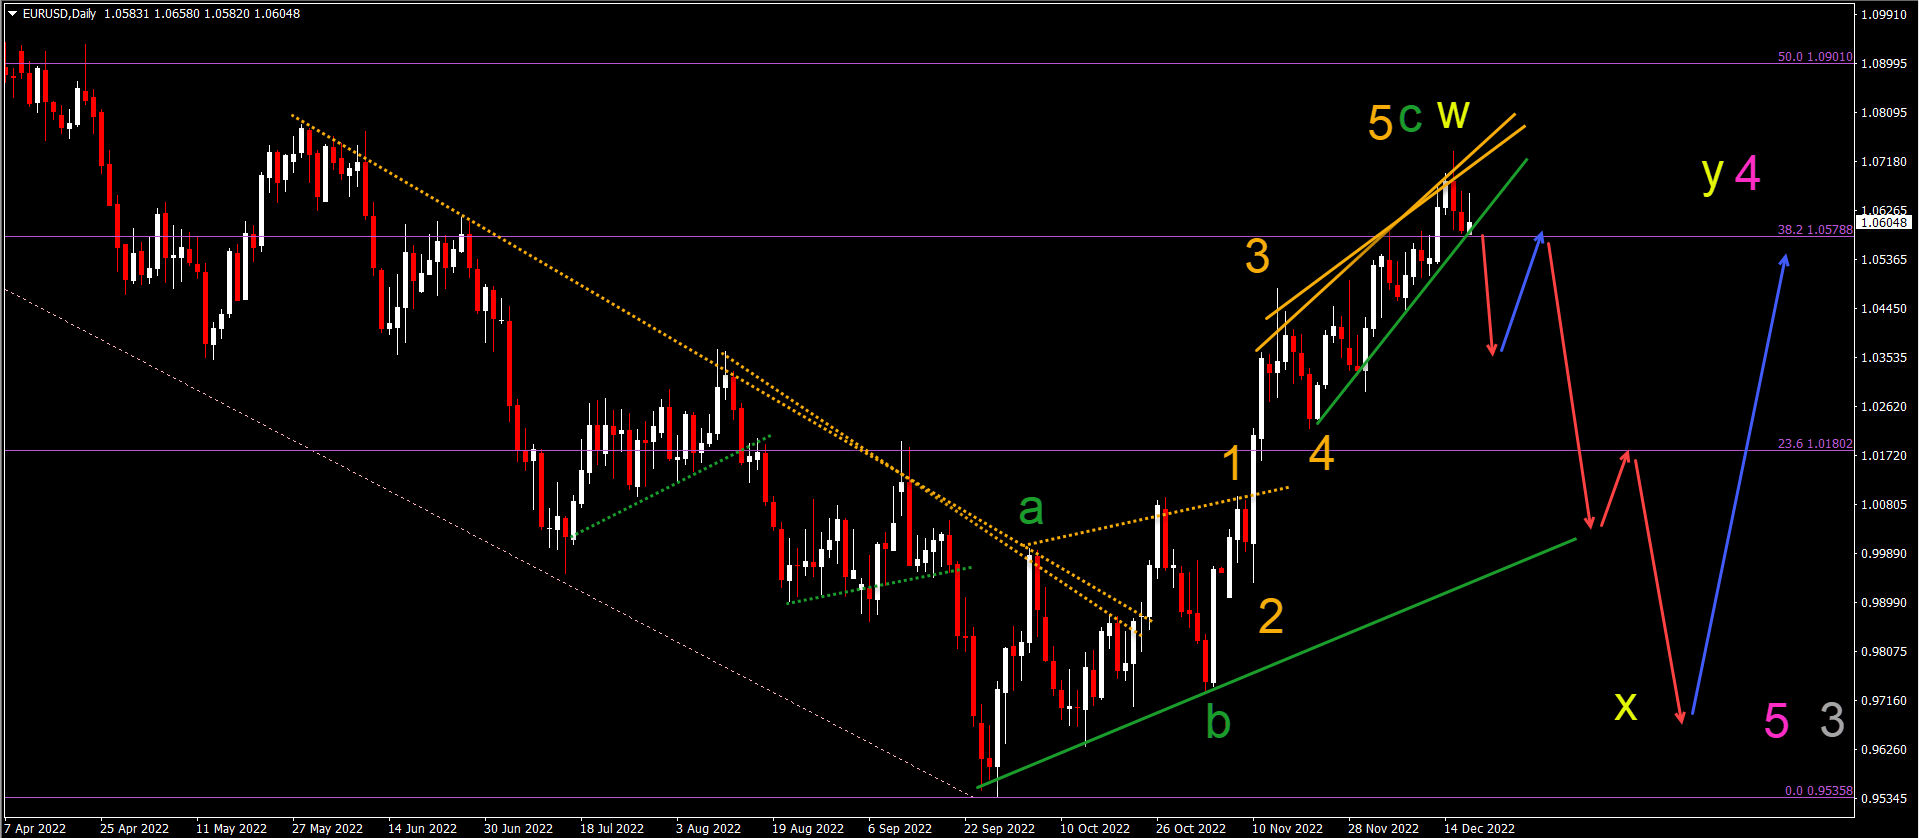
EUR/USD Bearish Candlestick Pattern Completes Bull Run
The EUR/USD is building a rising wedge chart pattern, which could indicate a bearish reversal soon:
- The EUR/USD is building a 5th bullish wave (orange).
- This 5th wave (orange) seems to be completed due to the strong bearish candlestick pattern last week.
- Price action is now testing the support trend line (green) of the rising wedge pattern.
- A breakout (red arrow) below the support line would confirm the end of the wave 5 (orange) of wave C (green) and wave W (yellow).
- A larger WXY (yellow) could develop within a wave 4 (pink) pattern.
ATHENA EA
#H1
#H4
#Time frames
Award Winning Momentum TradingPromo
Yearly Target:
220%
Risk/Reward:
0.36
Platforms:
MT4
Historical Drawdown:
30%
Min. Deposit:
50$
Asset Types:
Forex

Presented by
Chris Svorcik
Verified on:
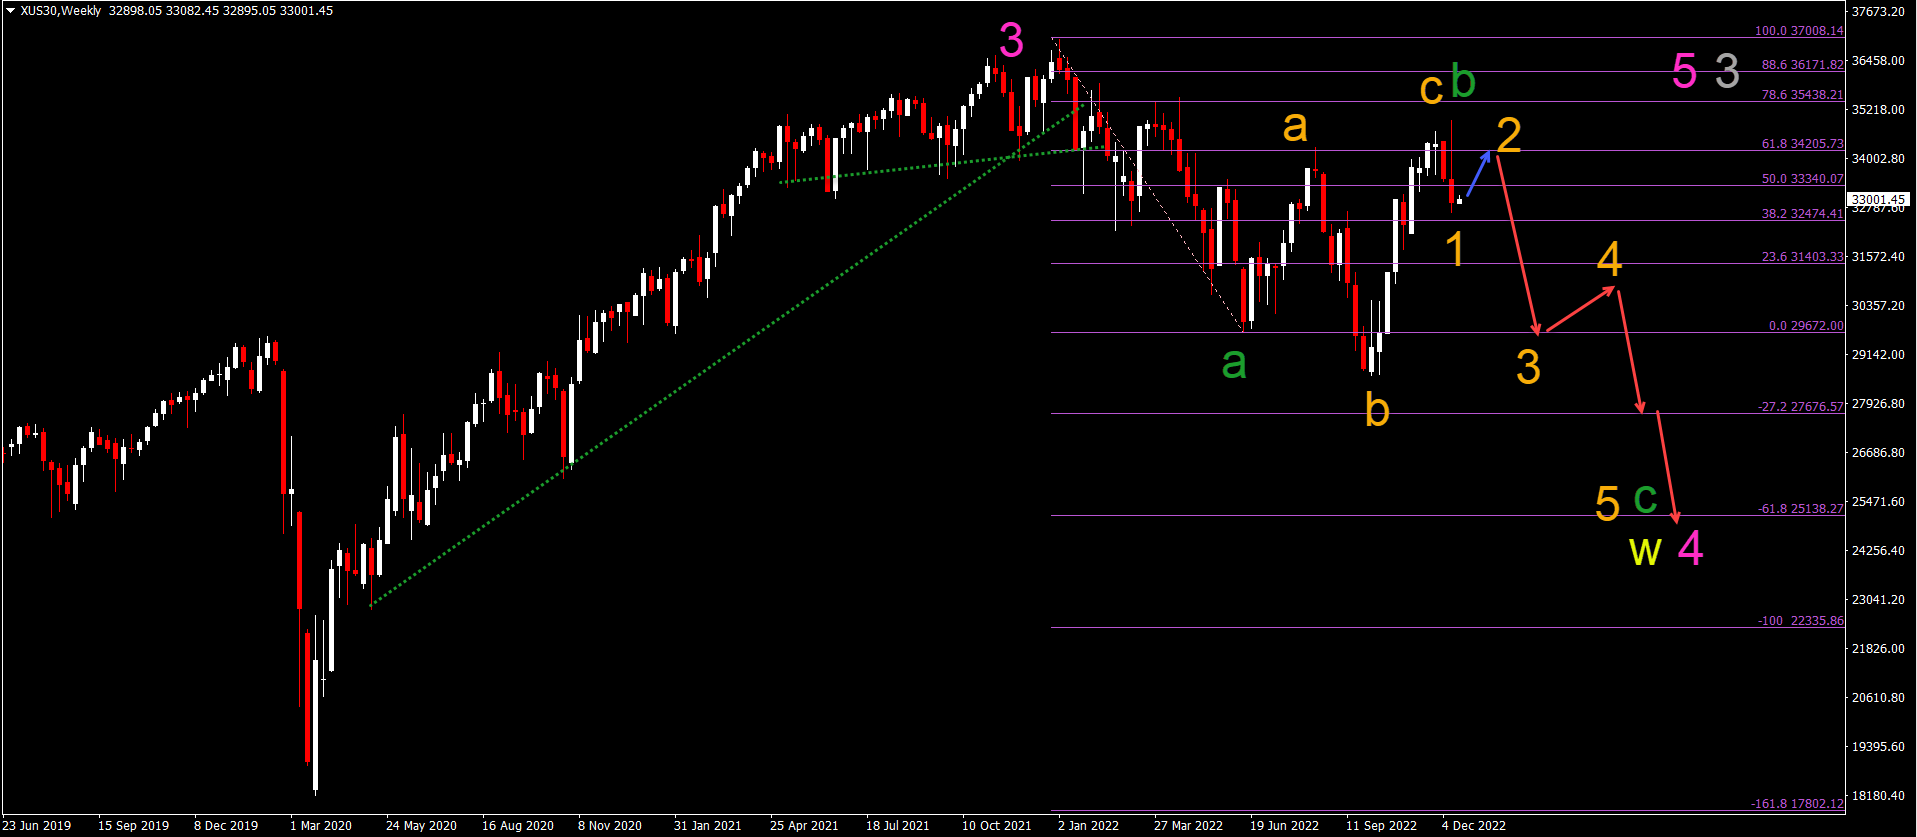
US30 Bearish Reversal Aims at $25k Support
The US30 chart made a strong bullish rally after breaking below the $30k support level. Let’s review the next expected price swings:
- The US30 has reached a key resistance zone due to the deep Fibonacci levels.
- The US30 showed strong bearish candlestick patterns at the resistance zone, which indicates a potential bearish reversal.
- The bullish swing is expected to be a wave C (orange) of a larger ABC (orange) correction in wave B (green).
- Now that the ABC (orange) of wave B (green) is completed, price action should start a downtrend within an impulsive wave C (green) of a larger ABC (green).
- The main bearish target is the -27.2% Fibonacci target at $27,676. The -61.8% Fibonacci target is located around the $25k support.
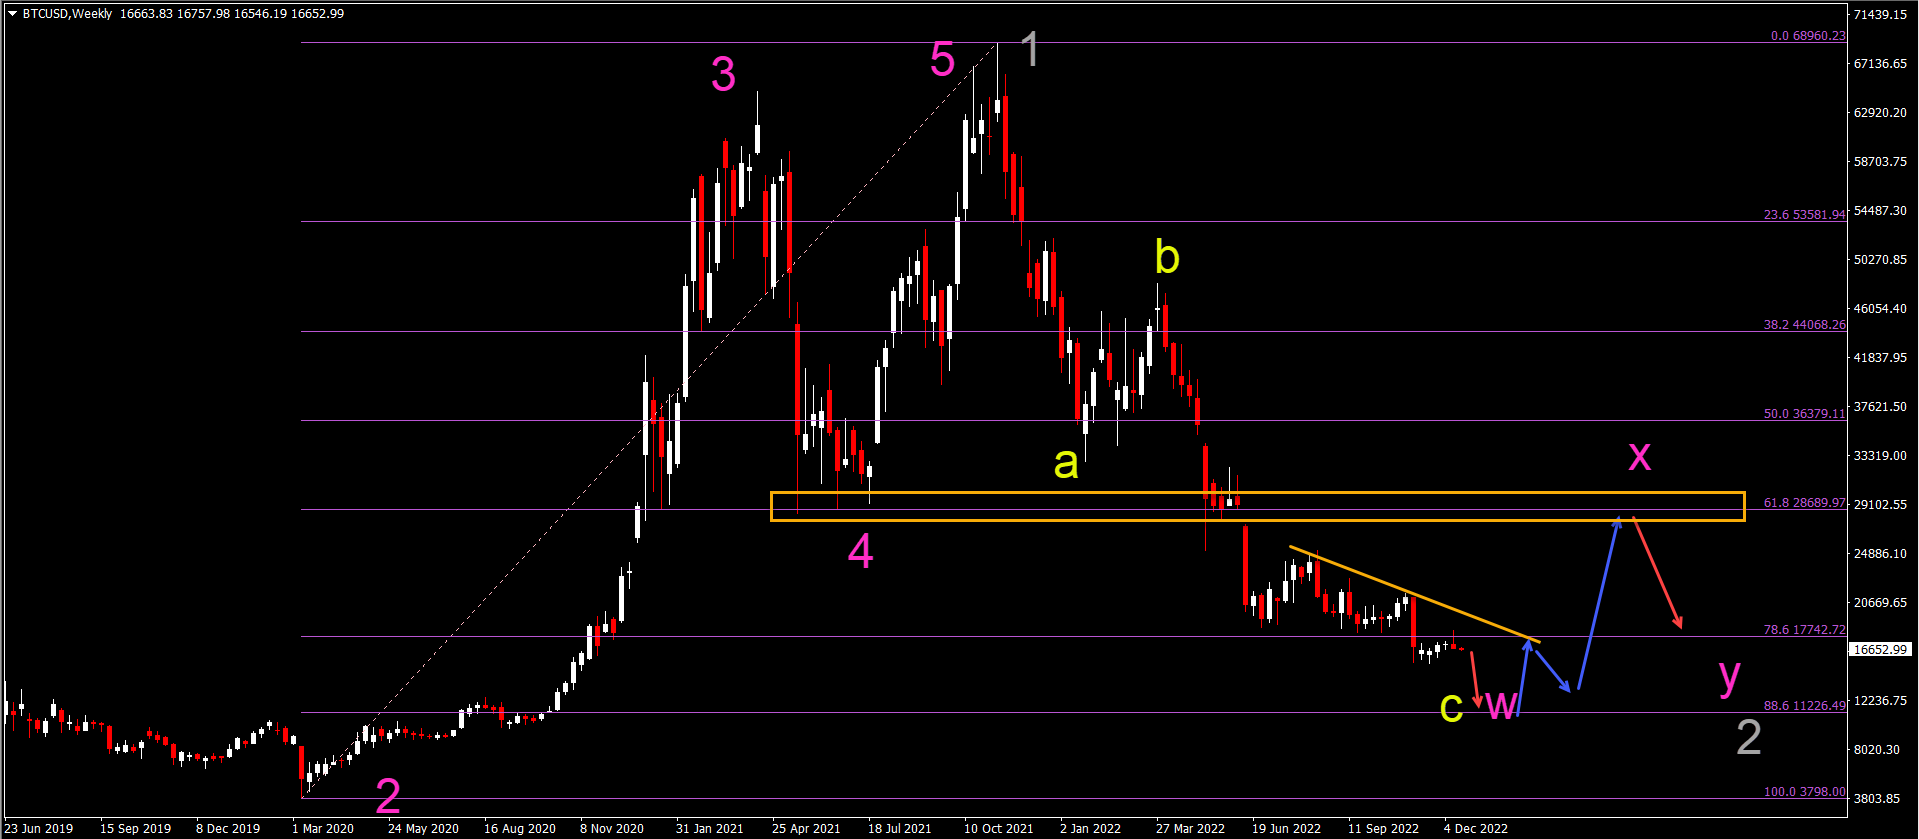
Bitcoin Rejection Weekly Candle
Bitcoin (BTC/USD) broke below the 78.6% Fibonacci retracement level and has been unable to break above that level ever since:
- The indecisive price action followed by last week’s bearish rejection candlestick pattern leaves the door open for a downtrend continuation.
- The next bearish price swing (red arrow) is aiming at the 88.6% Fibonacci around $11.2k.
- Price action could bounce back up (blue arrow) at this support Fibonacci level.
- A bullish bounce could mark the end of the bearish ABC (yellow) pattern within wave W (pink).
- A bullish bounce could be within a wave X (pink) of a larger WXY (pink) in wave 2 (gray).
Good trading,
Chris Svorcik


Leave a Reply