USD/JPY ??? Wave 1 Leading Diagonal Taking Shape
Subscribe
Dear Traders,
The USD/JPY is slowing revealing more about itself as price-action progresses upwards from the March low.
This analysis will provide an update on the USD/JPY reversal progress and highlight potential trade setups.
The USD/JPY has continued to trace out 3-wave swings in both directions since its low of Mar 26. Four swings have been completed, while the 5th (latest bullish thrust) started today during the early Asian session.
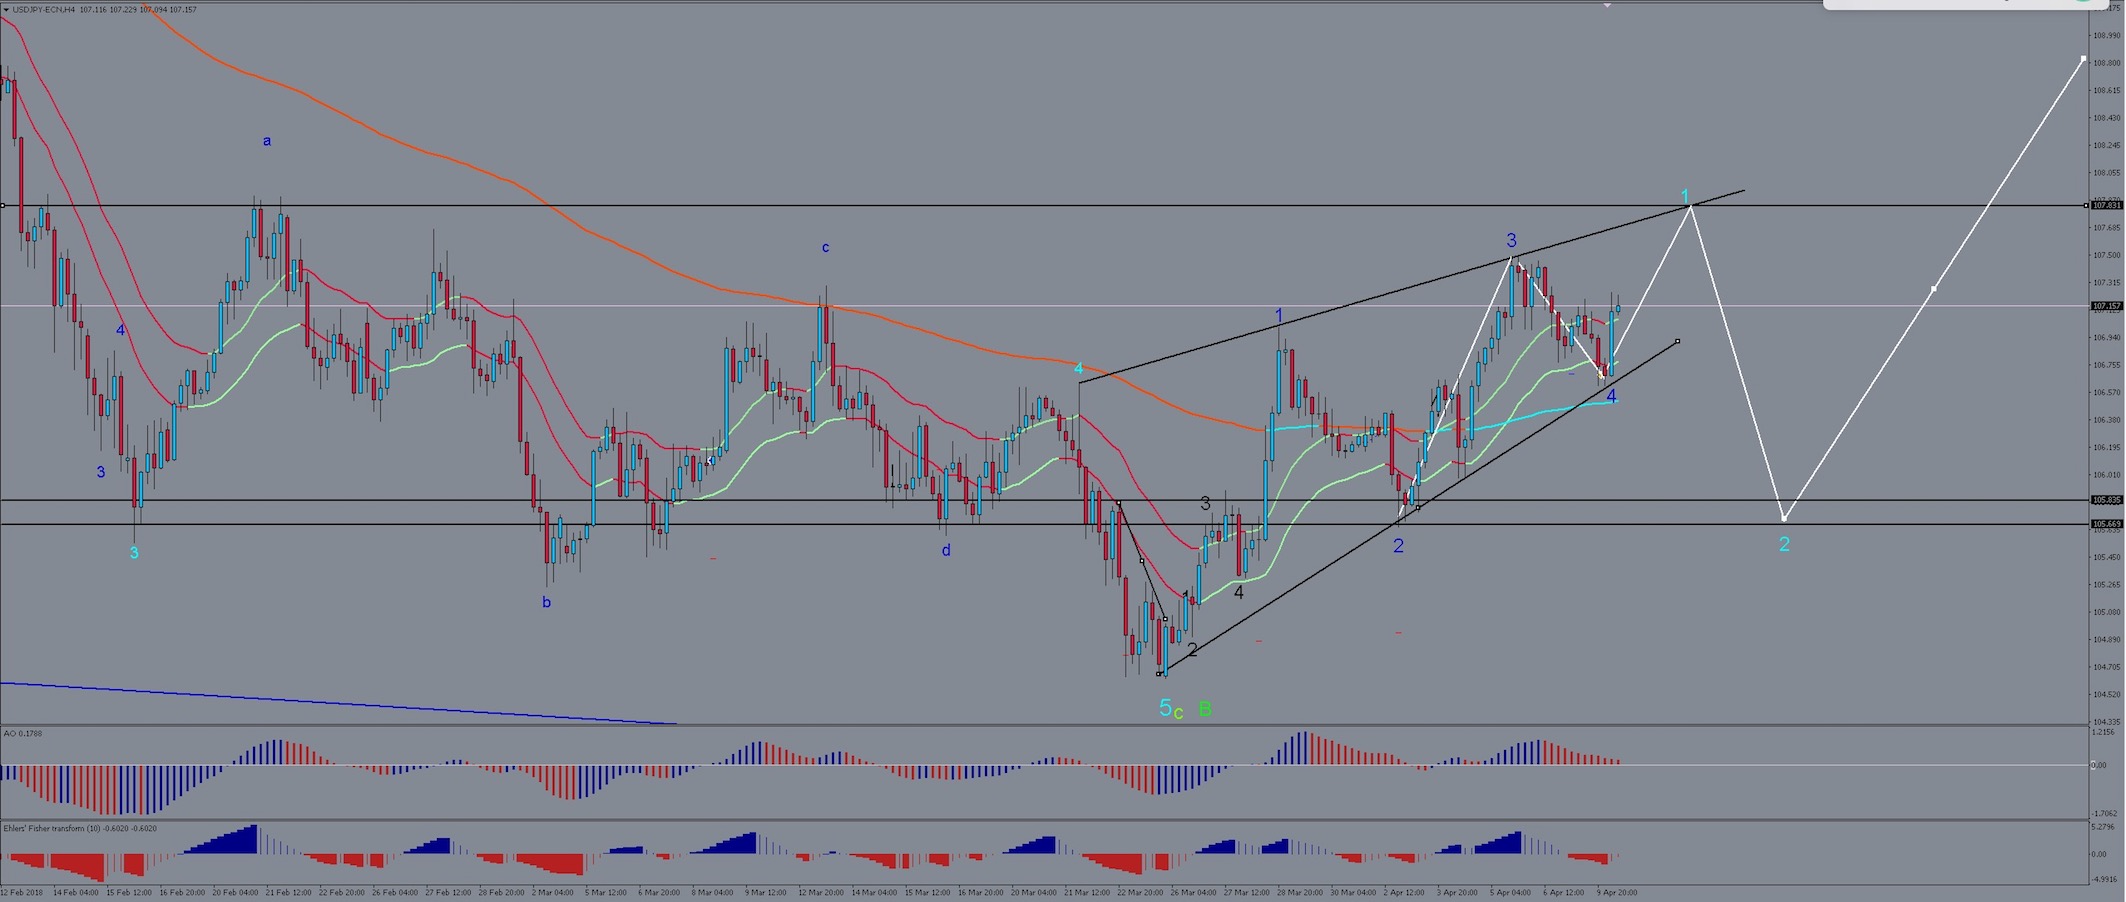
This price behavior fits most comfortably into either a leading diagonal or a triple zigzag. The latter seems less likely because all swings of the previous downtrend appear to have completed. The USD/JPY price action is also contracting, which is a classic behavior of diagonals. Furthermore, US indices, which show a certain degree of correlation with the USDJPY are mainly pointing towards another strong rally in the weeks ahead, which should also be followed by the USDJPY in a similar fashion. Other JPY pairs, like the EURJPY and NZDJPY, equally reveal bullish structures. These combined factors provide a bullish bias in my view, which is why I give the wave 1 leading diagonal scenario more credibility than a triple zigzag.
We should therefore expect another high to be established somewhere between 107.50 – 107.90.
107.80 could be a key level since it marks the very top of the previous range and coincides with with the wedge trendline (see black lines). However it is important to note that contracting diagonals can produce truncated 5th waves as well as ‘throw-overs’ (i.e. price briefly overshoots the upper wedge line and then reverses sharply). In any case, price should trace out another ABC zigzag on its way into the new high.
Trade Setups
2 major trade opportunities exists… one sell and one buy option.
Sell Trade: Selling towards to the end of wave 5 of the diagonal could be a great reward-to-risk ratio trade because diagonals tend to be retraced sharply and swiftly during the following wave 2. A Bearish bounce at the POC zone of around 104.80 could act as a good sell signal. The target for Wave 2 completion should be at the deeper fibs of the leading diagonal itself, i.e. 50%, 61.8% and 78.6%. A previous support zone that could come into play for the end of wave 2 is between 106 and 105.65.
Buy Trade: If the leading diagonal scenario is correct, then price should start out on an extended wave 3 to the upside after completing the bearish correction of wave 2. The target areas for the sell trade then become the Entry areas for the buy trade. Wait for a zigzag to the downside to show itself to be fairly complete, and look out for a reaction at the deeper Fibonacci levels and support zones that were mentioned above. Targets for these buy trade could be potentially be as high as 115.
All the best on your trading journey
Hubert

.


Leave a Reply