NZD/USD ❗️Bearish Fall After End of Long-Term Correction? ?
Subscribe
Dear Trader,
The NZD/USD has enjoyed a massive rally over the last weeks, but the long-term outlook looks mixed for the NZD with a potential for strong downside ahead.
This analysis will look at the bigger picture of the NZD/USD to try and discover what may be in stall for this currency pair.
NZD/USD in Long-Term Correction
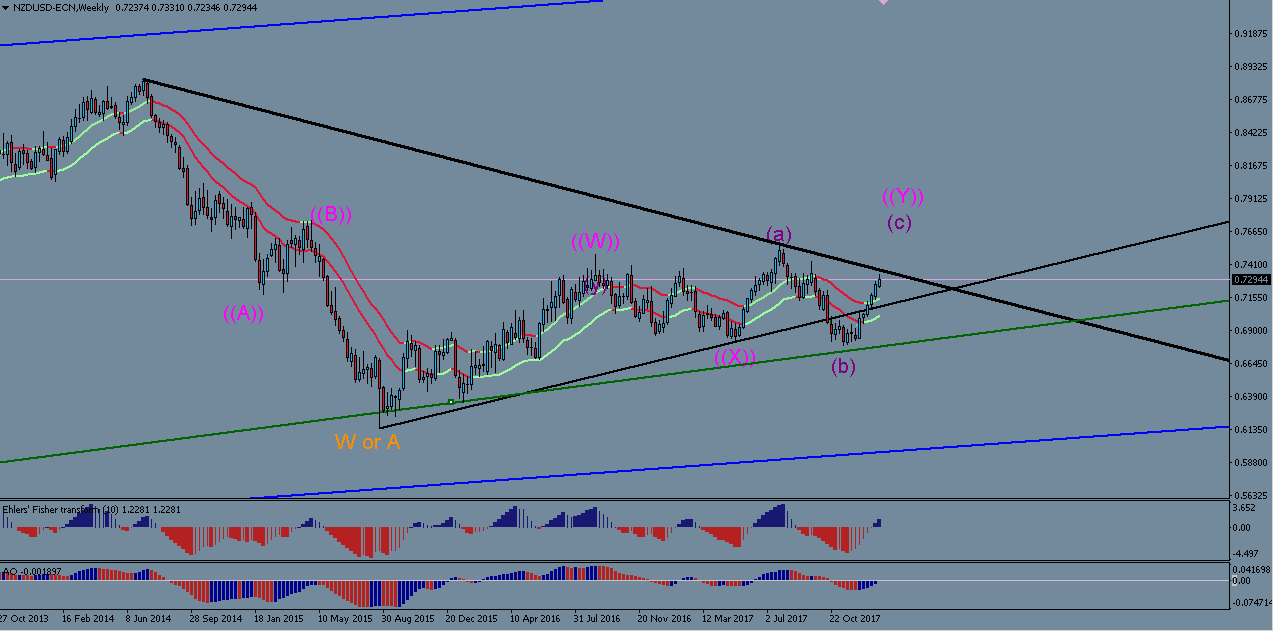
The weekly chart above shows how price has been in a corrective sideways structure since 2015.
The downtrend during the later part of 2017 had looked suspiciously like the end of the correction cycle because it broke the black support line, but the very strong bullish uptrend that followed means that we are back within this long-term range.
From an Elliot Wave perspective the last up-down-up since 2017 (i.e. purple abc) could be a type of ‘flat’ correction or a ‘zig-zag’.
If it is a zig-zag, we should see price break above the high from July 2017 (0.7540). If it is a flat, price could turn southwards prior to reaching the previous high. The black resistance trend line will be an important decision point. The current bullish trend has been a pure impulse and it appears that a wave 4 and 5 are still due before a reversal may occur.
If the reversal does occur, price should fall quickly and finally break out of the long-term range for good.
All the best along your trading journey
Hubert
.


Leave a Reply