NASDAQ – Bearish Correction Ahead
Subscribe
Dear Traders,
Today’s analysis will provide a technical overview of the short-term picture for the NASDAQ index.
Bearish Correction on the Horizon
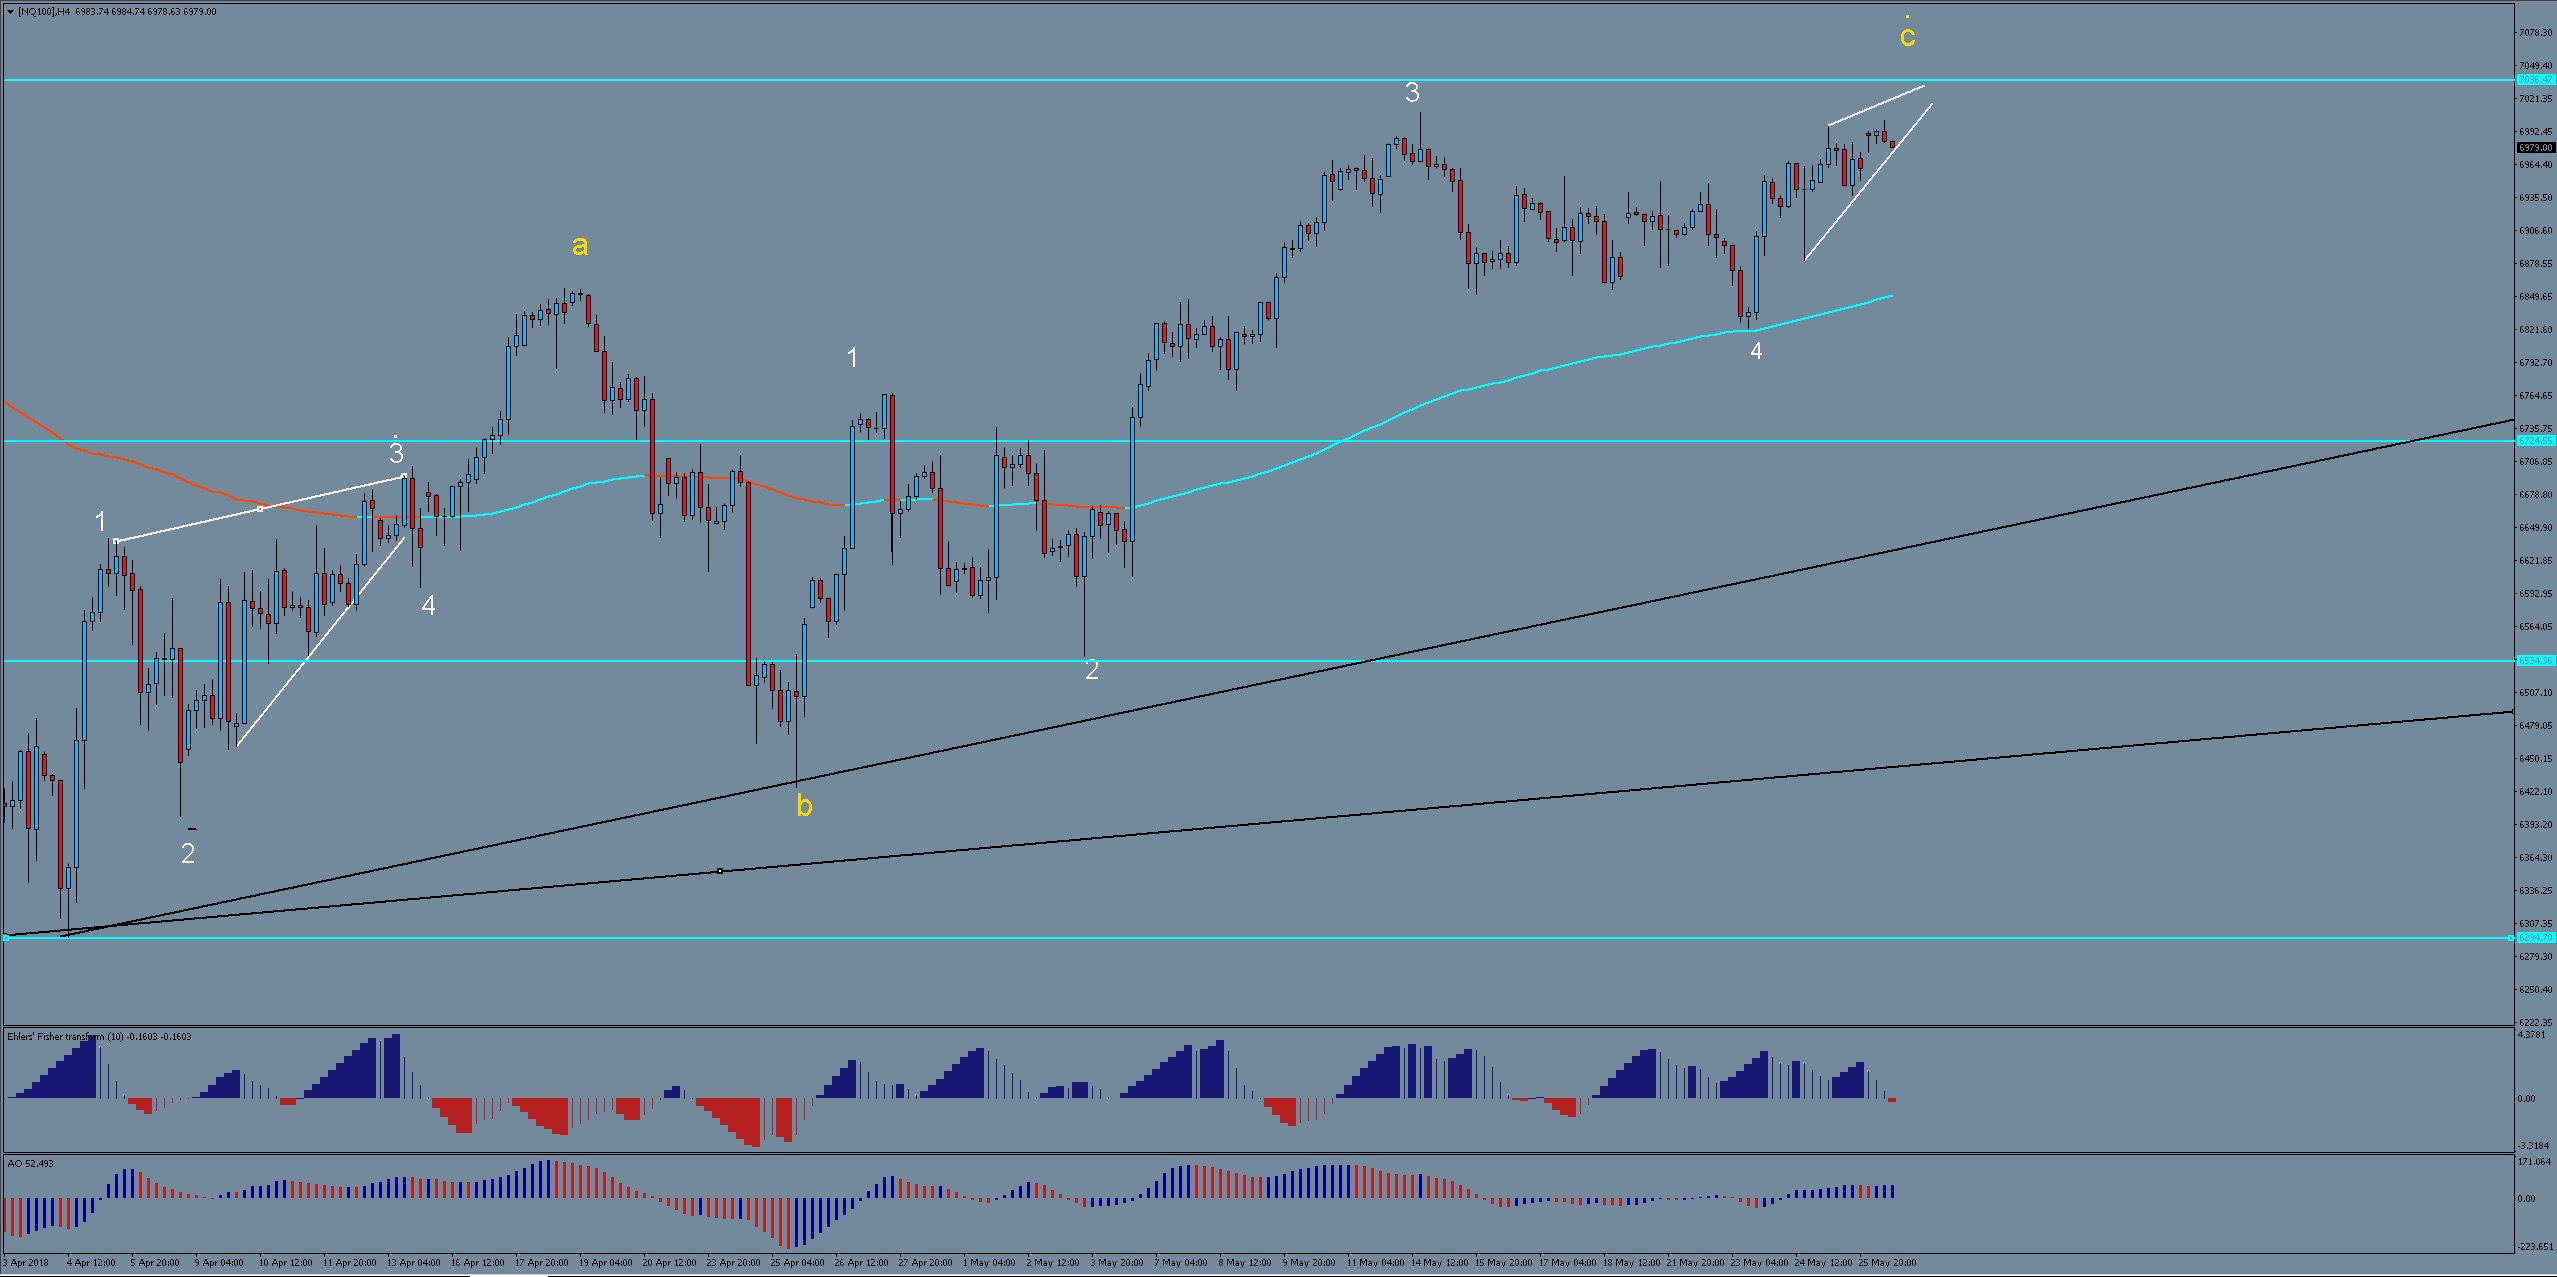
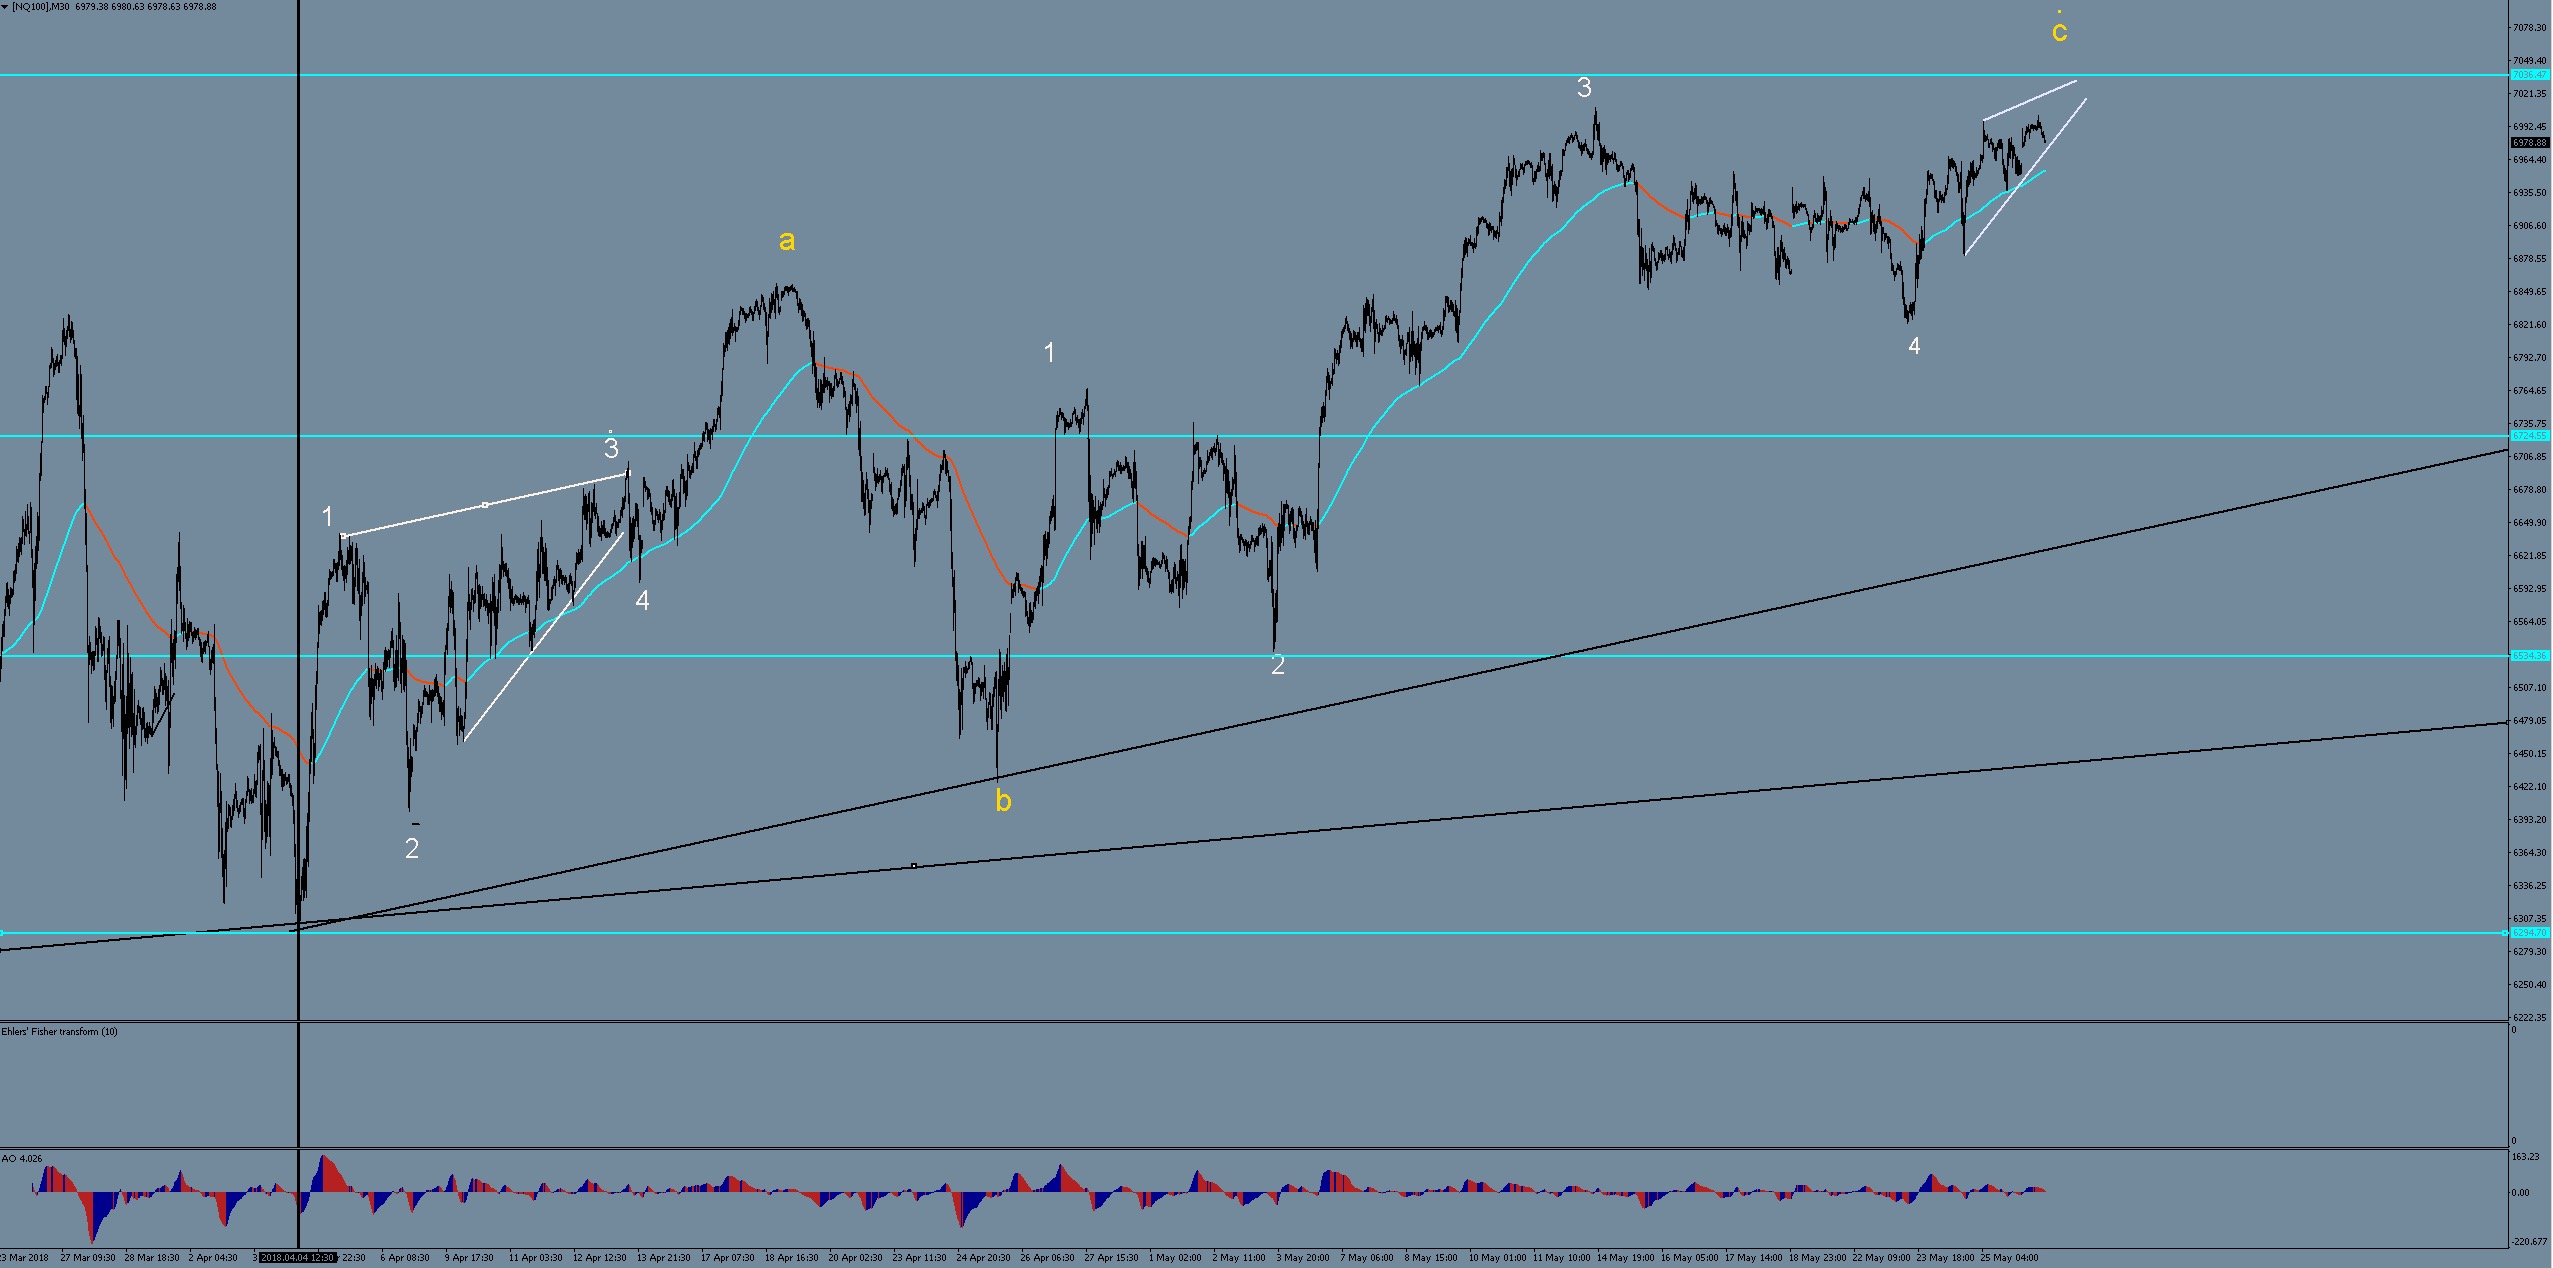
The NASDAQ index finds itself most likely still within a complex correction. The important point for today’s short-term analysis is that chances are good that price will not rally directly from here into a new high. Price action since the Apr 4 low works best as an ABC zigzag. Only a powerful increase in bullish momentum could turn this into a direct trend continuation, but price behavior is pointing against such a scenario. Hereis what I see:
- Momentum has virtually ground to a halt
- Given that price is ranging since early 2018, moving averages are of little use. Instead, horizontal support and resistance levels become most important. In this regard, price is approaching a key resistance zone around 7035. Moreover, it is doing so via 3-wave swings since the May 23 low, which suggest a potential ending diagonal in the making, which would also fit with its Elliot Wave position (i.e. wave 5 of c).
Therefore the short-term bias is to the downside, especially if a wedge continues to form while slowly grinding towards 7035.
It is difficult to determine at this time where exactly a potential bearish move could end. However initial key support area comes in around 6720. If these levels don’t hold, a drop towards 6530 becomes quite likely. The most bearish scenario could even target a price within the range of 6295 – 6170.
For immediate trading purposes, it may be best to trade mainly off r/s levels and momentum changes, with short-term targets.
All the best along your trading journey
Hubert
.


Leave a Reply