🎯 GBP/USD Wrestle Back Control & Aim for 1.40 Target 🎯

Dear traders,
The GBP/USD broke below the rising wedge… but price action failed to reverse.
Instead, price action bounced at the long-term moving average and support zone (blue box) again.
The bulls are back in control (as mentioned in the EU-GU video) and looking for a bullish breakout now.
Price Charts and Technical Analysis
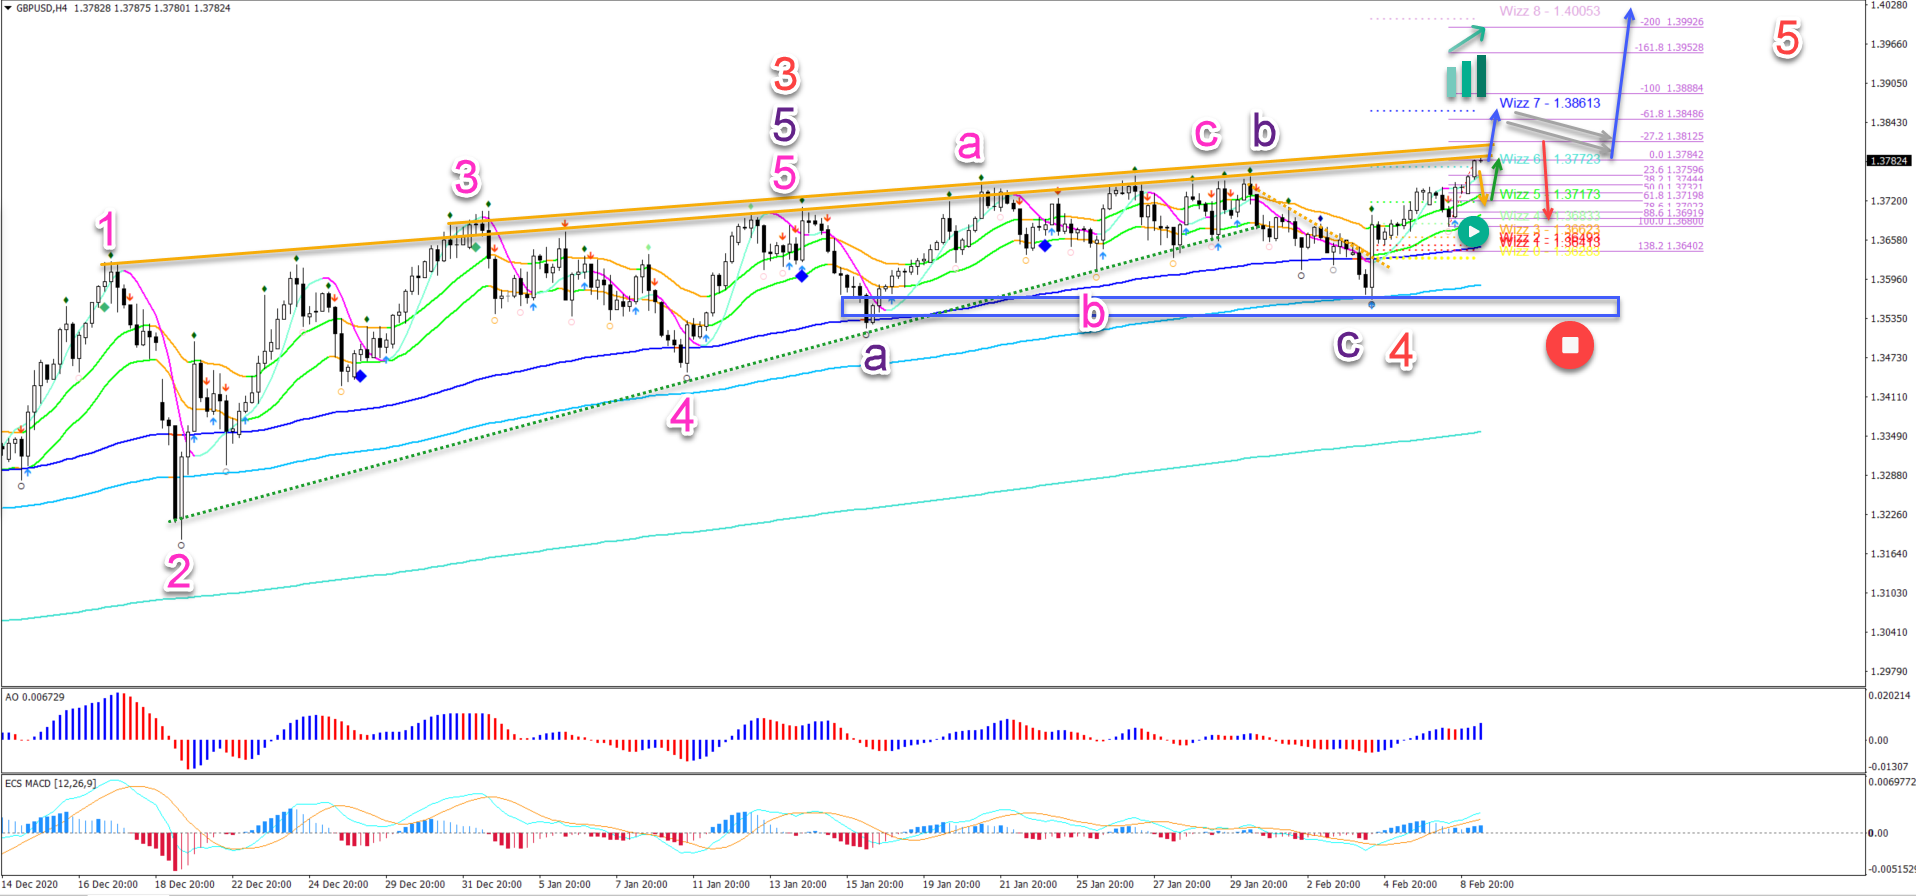
The GBP/USD quickly tested the 21 ema zone and bounced back upwards (green circle). Price is now testing a key decision zone, which are the resistance trend lines (orange).
- A bearish bounce (orange arrow) could indicate a fall back towards the 21 ema zone.
- A bullish bounce (green arrow) is expected at the 21 ema zone.
- A breakout (blue arrow) is expected either immediately or after the pullback.
- The 1st target is Wizz7 level at 1.3860.
- A bull flag pattern (grey arrows) could confirm another push up (blue arrow).
- The 2nd target is Wizz8 at 1.40.
- Only a strong reversal impulse (red arrow) ends the uptrend.
The bullish price action is part of a wave 5 (red) after price action completed an ABC (purple) within wave 4 (red).
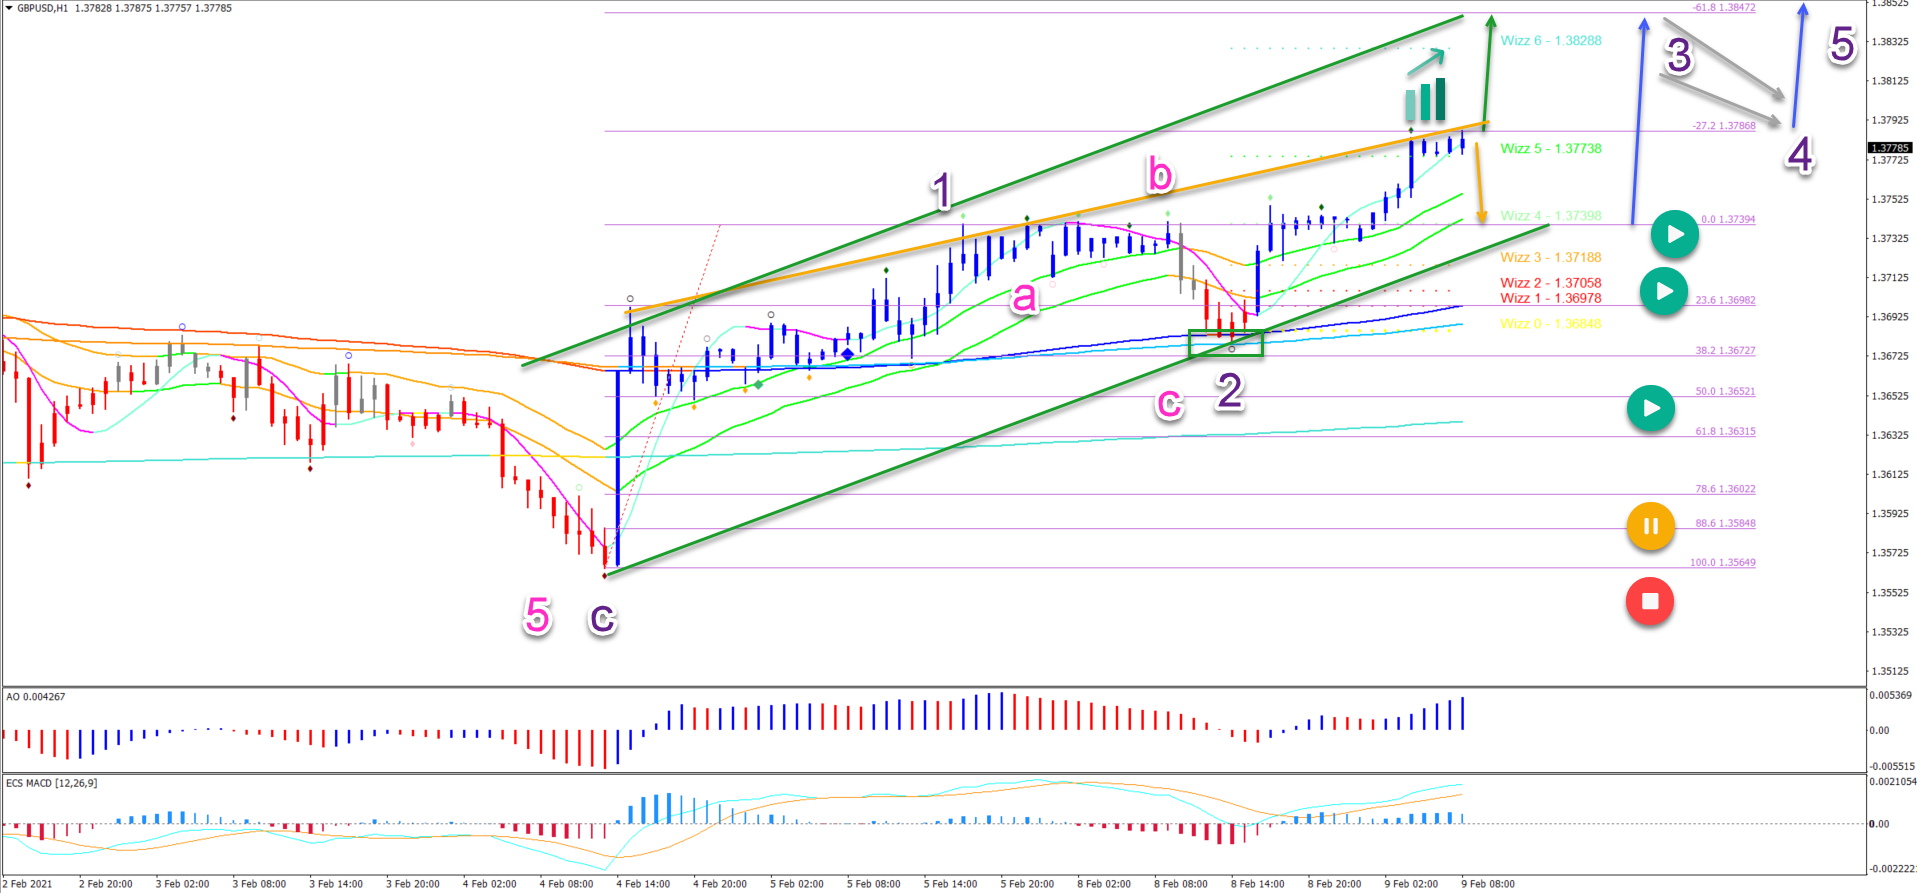
On the 1 hour chart, price action has reached the -27.2% Fibonacci target after bouncing at the 38.2% Fib and 144 ema close (green box).
- A bullish breakout (green arrow) is aiming for the -61.8% Fibonacci target.
- A bearish bounce (orange arrow) should see support at the previous top (blue arrow).
- A bull flag (grey arrows) could indicate a continuation of the uptrend.
All of the Fibonacci levels are expected to act as support (green circles), in case price does retrace lower. Only a deeper retracement places it on hold (yellow & red).
The analysis has been done with the indicators and template from the SWAT method (simple wave analysis and trading). For more daily technical and wave analysis and updates, sign-up to our newsletter.
Good trading,
Chris Svorcik


Leave a Reply