? GBP/USD Breakout Completes Bearish Wave ABC Zigzag ?
Subscribe

Hi traders,
The GBP/USD made a strong bearish breakout below the support trend line. The GU is now testing a 78.6% Fibonacci level of a potential wave B (blue), which could be part of a larger ABC zigzag pattern.
GBP/USD
4 hour
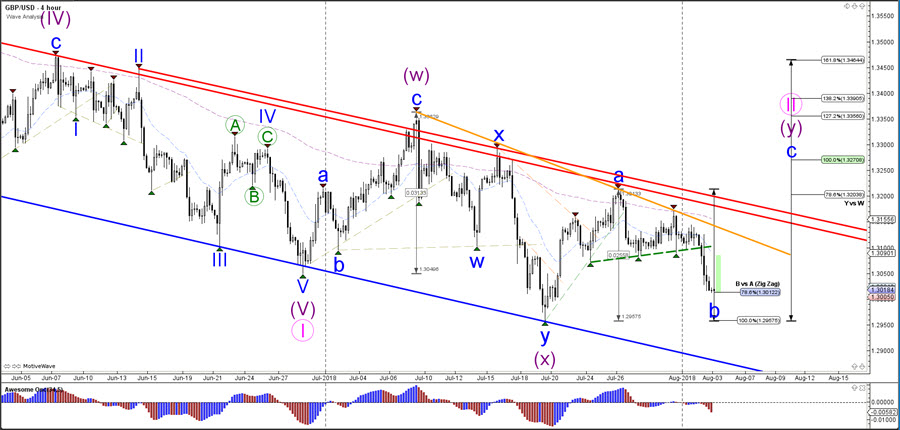
The GBP/USD seems to be completing an ABC within the wave B when considering the 3 wave pattern but a bearish breakout below the Fibonacci levels of wave B vs A would change the perspective. In that case a bearish wave becomes more likely. A bullish bounce at the Fibs could indicate the start of a bullish wave C (blue).
1 hour
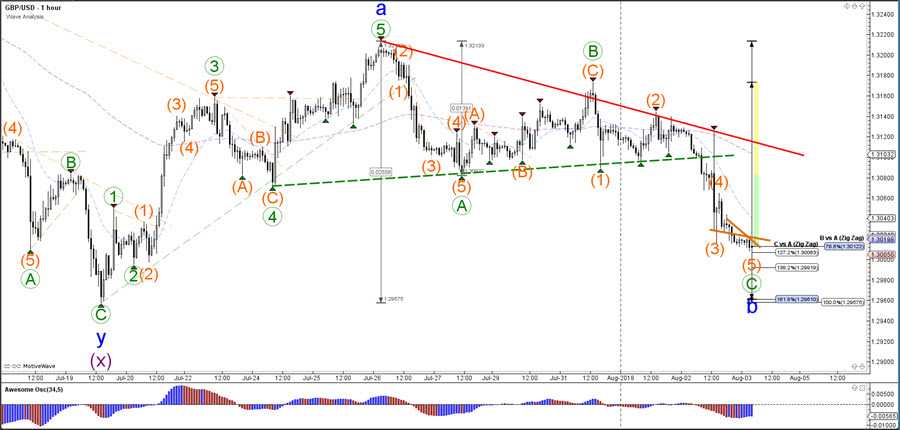
The GBP/USD seems to be making a bearish ABC (green) pattern as expected after completing 5 bullish waves within wave A (blue). The bearish wave C (green) could have completed an internal 5 wave (orange) pattern after breaking below the support trend line (dotted green). Due to the strong bearish momentum, price will need to show a bullish breakout and momentum before indeed the end wave B (blue) becomes more confirmed.
Good trading,
Chris Svorcik
Elite CurrenSea


Leave a Reply