? EUR/USD Preparing for Bearish ABC Zigzag Pattern ?
Subscribe
Hi traders,
The key question is whether the EUR/USD is building a bearish correction within the uptrend (wave 2 green) or a bearish impulse within a larger ABC zigzag (brown). The answer will depend on the breakout direction and momentum on the 1hour chart.
EUR/USD
4 hour
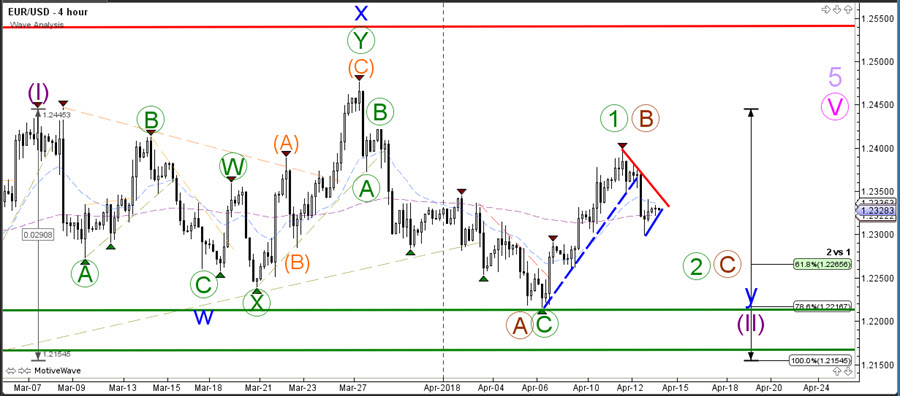
The EUR/USD uptrend channel did indeed break as mentioned in yesterday’s analysis (EUR/USD losing steam). The bearish breakout could lead towards a larger bearish correction, although a bullish bounce remains possible in this choppy environment.
1 hour
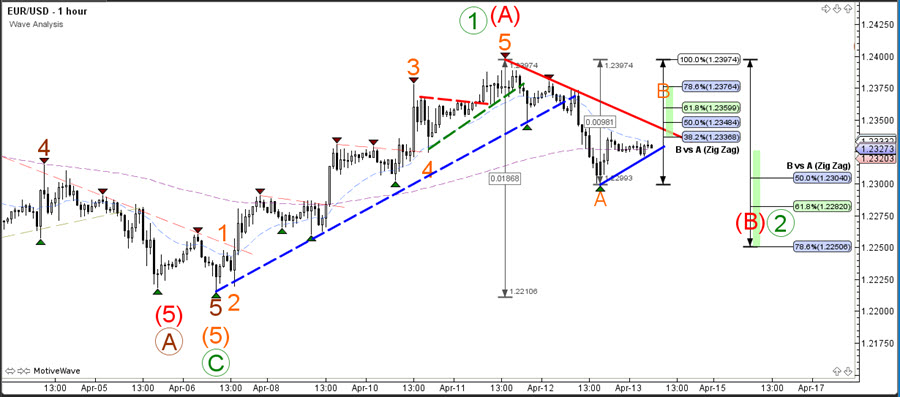
The EUR/USD made a bearish break below the support (blue) trend line, which could indicate a larger bearish ABC correction. A break above the 100% Fib level of wave B (orange) could indicate an uptrend continuation rather than an ABC correction. The wave count be part of a larger wave 2 (green), wave B (red) or even wave C of wave 2 (brown 4 hour chart) and whether price moves quickly or correctively will provide more information about the wave patterns.
GBP/USD
4 hour
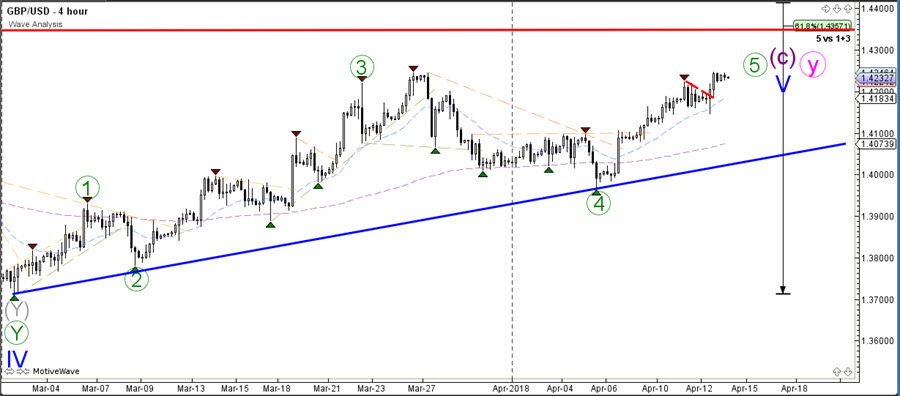
The GBP/USD is in a strong bullish trend and moving higher as part of the 5th wave (green).
1 hour
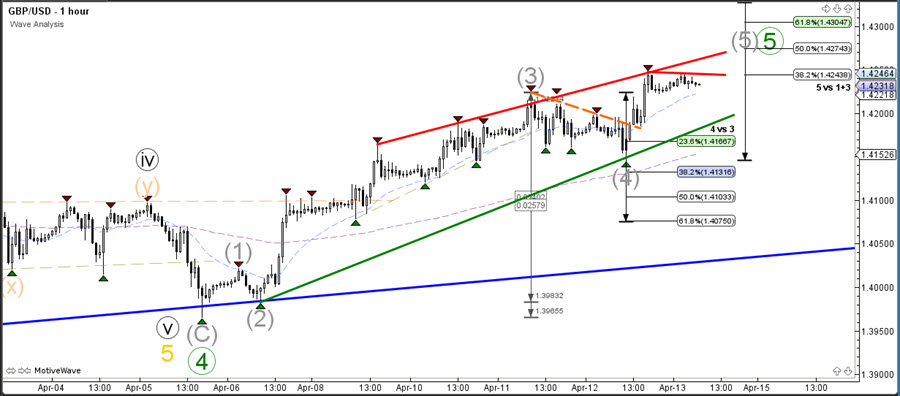
The GBP/USD completed a wave 4 (grey) retracement pattern and now is building a bullish wave 5 (grey) continuation. A break above the resistance levels (red) could price continue higher but potential targets are nearby at 1.4275, 1.43, 1.4325.
Good trading,
Chris Svorcik
Elite CurrenSea
.


Great analysis! Couldn’t you start from the Daily or Weekly chart for perspective purposes? A great break from the usual. Will US indices, Cryptos and Precious metals be covered in this format in the future? Thanks
Hi Morris, thanks! Happy to hear it 🙂 We often look at those higher time frames but with every video because it could be repetitive for regular viewers so only discuss bigger picture once in a while. We add other instruments indeed but only when a new market pattern appears 🙂