🎯 EUR/USD Descending Wedge Chart Pattern Aims at 1.20 & 1.1875 🎯


Dear traders,
the EUR/USD is building a descending wedge triangle chart pattern. This indicates a bearish breakout sooner or later. Let’s review the key support and resistance zones.
Price Charts and Technical Analysis

The EUR/USD needs to break below the triple bottom at around 1.2050. This would confirm the bearish breakout below the ascending wedge and a downtrend.
The first main target is at the 1.20 support zone. Here a bullish bounce could take place but ultimately price action could fall towards 1.1875 and even 1.1750.
If price action, however, fails to show a bullish breakout, then price action could break the resistance (blue arrows). A bullish breakout could aim at the Fibonacci retracement levels.
A bearish bounce at the 50-61.8% Fibonacci could indicate a bearish ABC (purple) zigzag pattern. Whereas a deeper retracement above to the 78.6% or above is either an ABC flat or ABCDE triangle pattern.
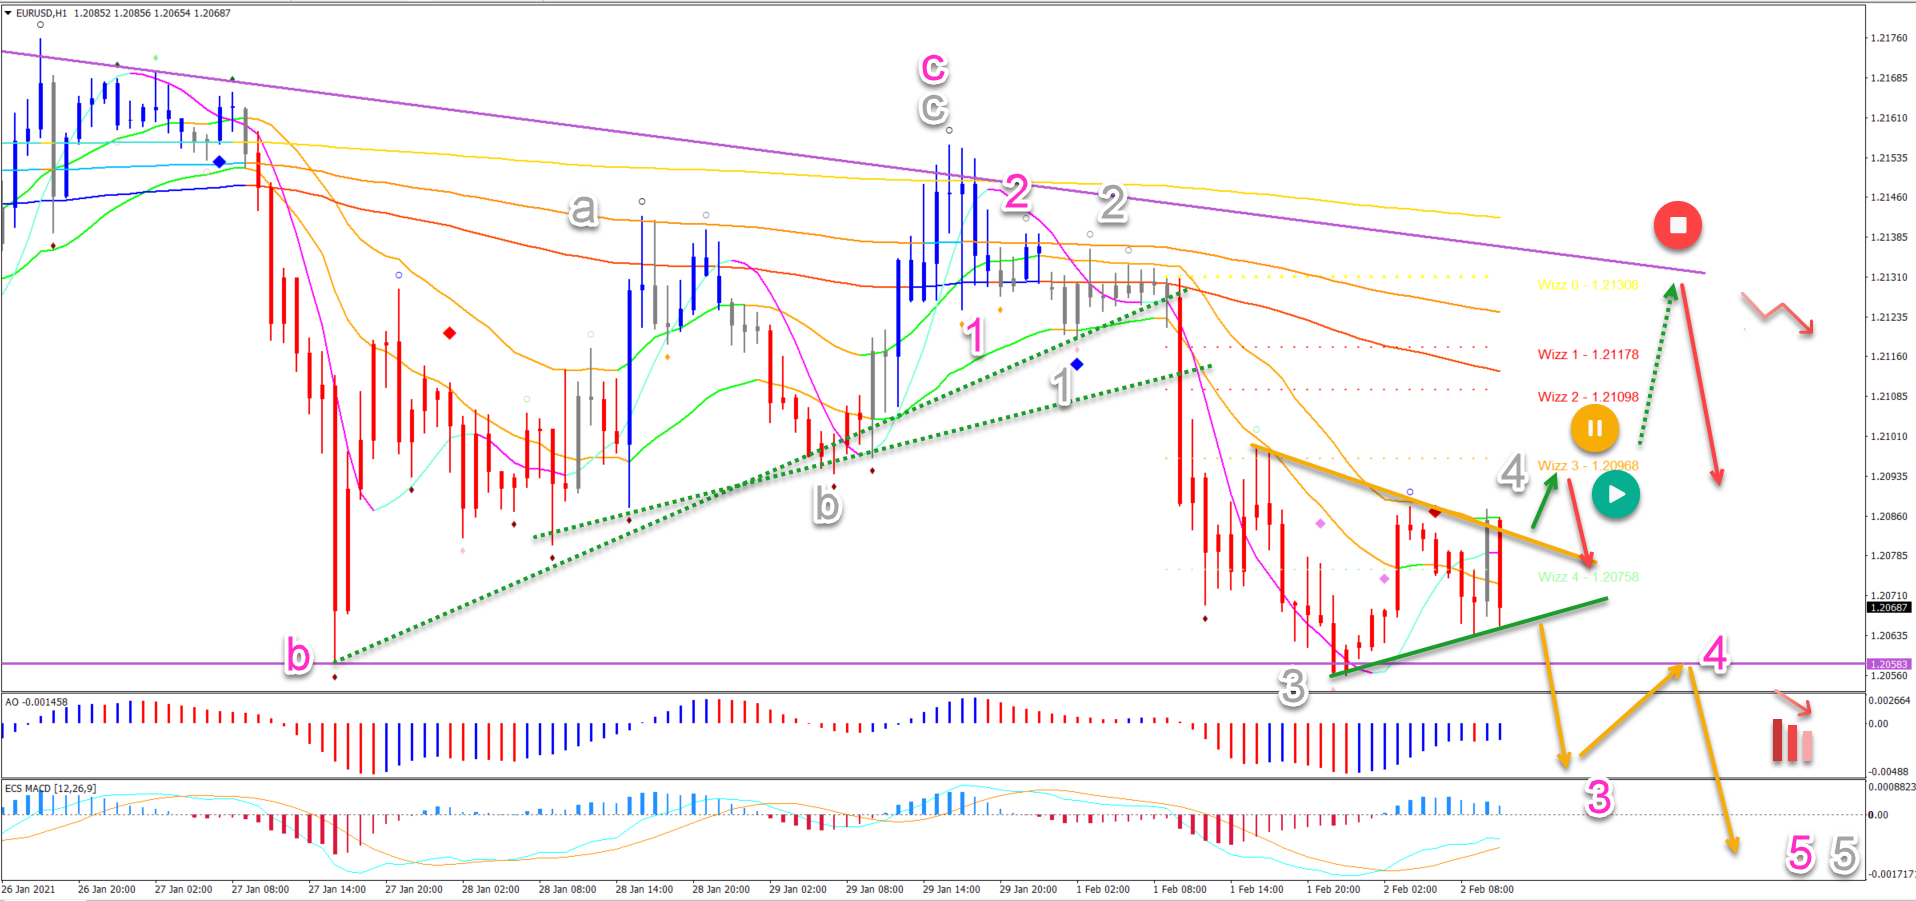
On the 1 hour chart, the price action needs to break support (green) for a breakout lower (orange arrows). This could indicate a 5 wave (pink) pattern in wave 5 (grey).
A bullish breakout might just be a pullback in wave 4 (grey). A bearish bounce is needed at the Wizz 3 level to confirm the downtrend (red arrow).
A bullish breakout above Wizz 3 could indicate a deeper retracement towards the main resistance trend line (purple). A break above that indicates that the bears lost control and invalidates this bearish analysis (red circle).
The analysis has been done with the indicators and template from the SWAT method (simple wave analysis and trading). For more daily technical and wave analysis and updates, sign-up to our newsletter.
Good trading,
Chris Svorcik


Leave a Reply