☝️ EUR/USD Builds Bear Flag in ABC Zigzag Pattern ☝
September 4, 2018
2 min read
Subscribe
Hi traders,
The EUR/USD is building a small corrective bear flag chart pattern at the support trend line (green). A bearish breakout could take price down to the Fibonacci retracement levels of wave B vs A.
EUR/USD
4 hour
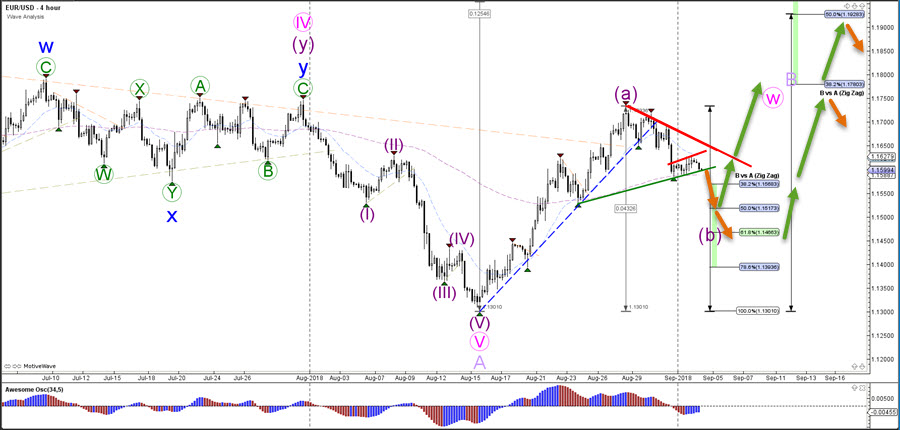
The EUR/USD seems to be completing a bullish ABC (purple) pattern and price is now expanding the wave B. A break below the bottom and 100% Fibonacci level invalidates the larger ABC zigzag pattern. Usual bouncing spots for a wave B are the 38.2, 50 and 61.8% Fibonacci retracement levels.
1 hour

The EUR/USD seems to be building a bearish ABC (green) pattern within the wave Y (blue) of a larger wave B (purple). The wave B (green) is invalidated if price breaks above the 100% Fibonacci level.
Good trading,
Chris Svorcik
Elite CurrenSea


Leave a Reply