❗️ DJI30 Prepares for Bearish Correction but Uptrend Expected Later in 2021 ❗️

Dear traders,
the Dow Jones Index (DJI or US30) showed a strong bearish weekly candle last week. The bearish wick plus the strong close near the low is indicating a potential retracement.
Let’s review the reversal charts and analyse how deep the bearish correction can go.
Price Charts and Technical Analysis
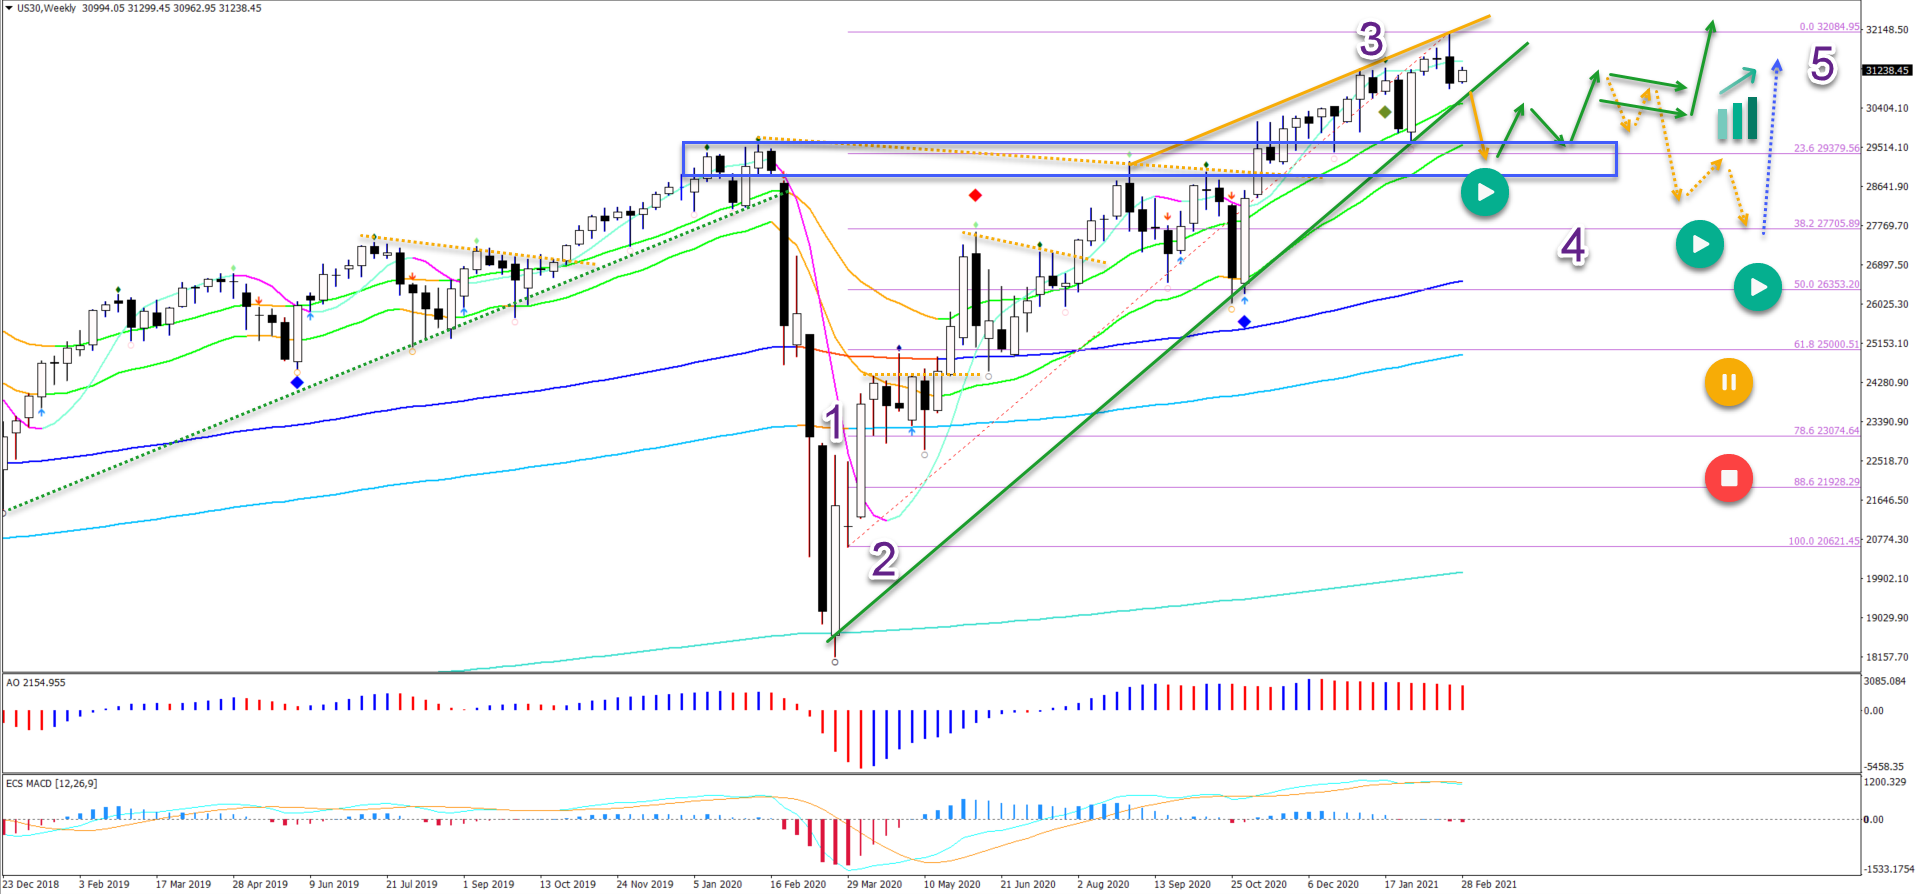
The DJI30 is unlikely to create a large bearish retracement. But the probability of some shallow correction has increased and is now the most likely scenario. Here are the main factors to consider:
- Last week’s bearish weekly candle.
- A rising wedge reversal chart pattern (green and orange lines)
- The end of the wave 3 (purple) potentially.
- A pullback is expected to be a wave 4 (purple), which is usually shallow.
- The previous broken tops are now acting as potential support (blue box).
The most likely scenario is that price action will build a choppy and shallow correction to either the 23.6% or 38.2% Fibonacci retracement level.
The uptrend is expected to continue later in 2021 after the retracement has been completed.
- Price action could either use the 23.6% Fibonacci for the uptrend bounce (green arrows).
- Or use the 38.2% Fib for the uptrend (dotted blue arrow).
- Only a deep retracement below the 50% Fib places the uptrend on hold (yellow button) or below the 78.6% invalidates it (red circle).
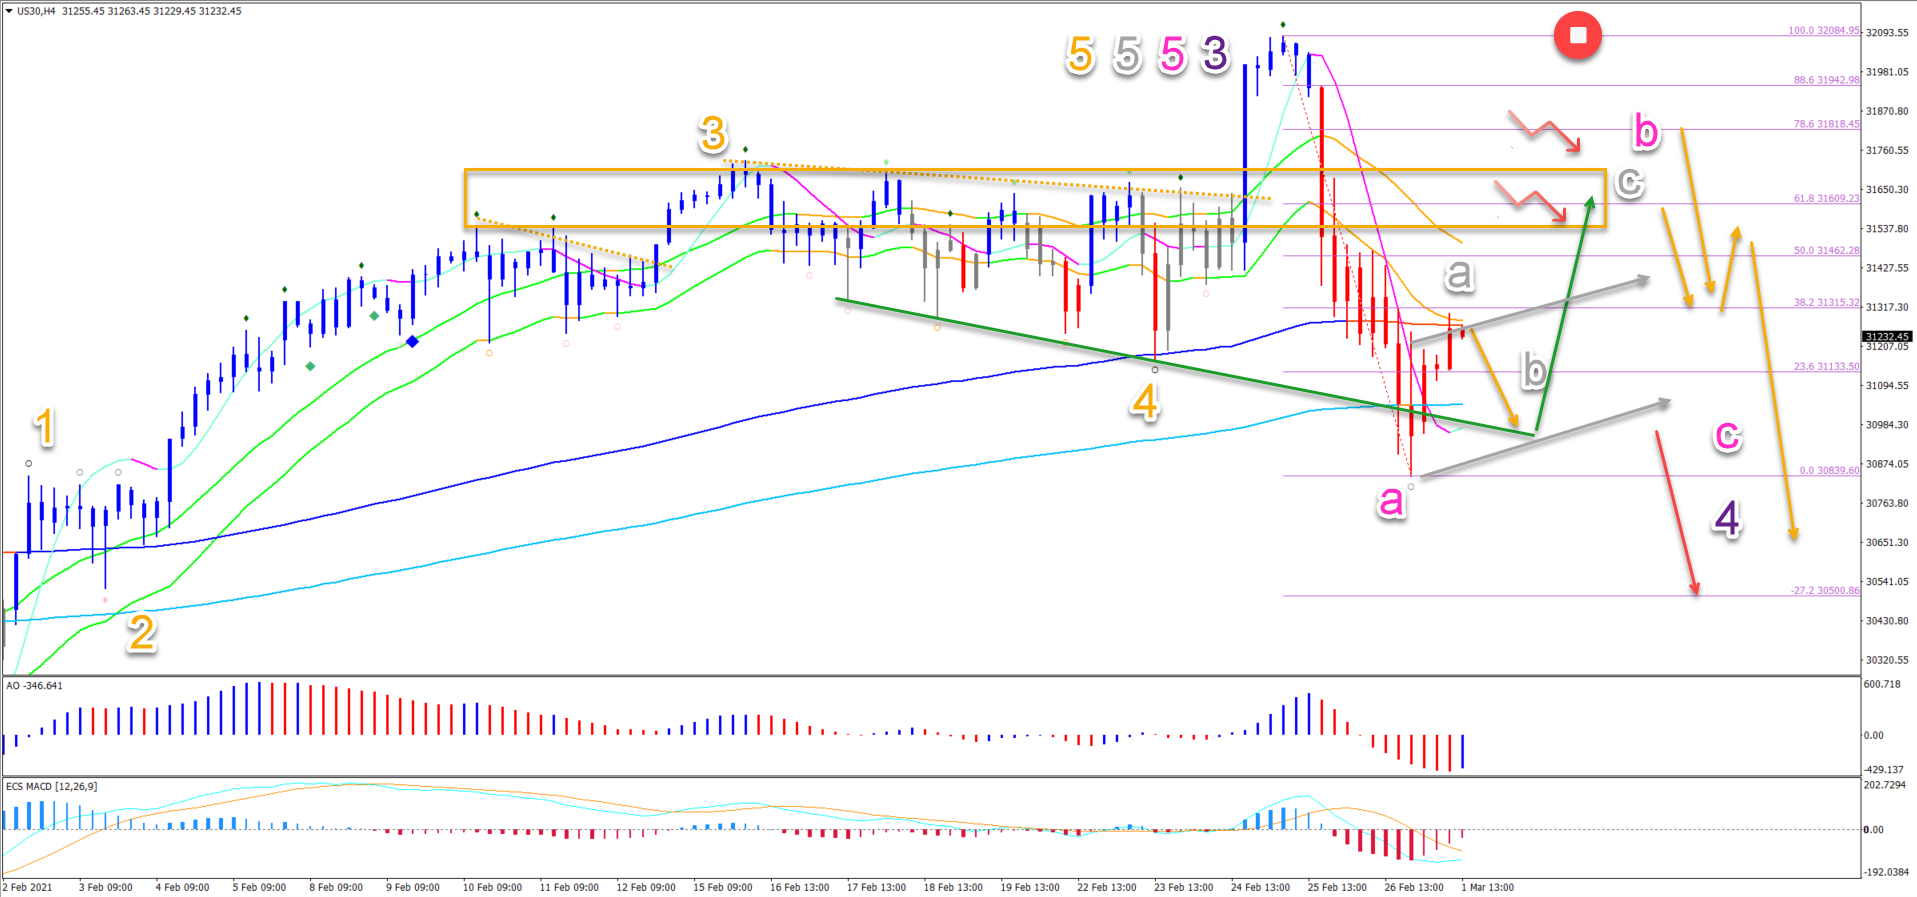
On the 4 hour chart, price action seems to have completed a wave 5 (orange). The current decline is probably the first price swing of the wave 4 (purple).
- The decline looks like a wave A (pink).
- The current retracement could be a wave B (pink).
- An ABC (grey) pattern is expected in wave B (pink).
- The main resistance levels are the Fibs and previous tops (orange box)/
The alternative scenario is if a bear flag chart pattern emerges (grey arrows). For the moment though, a larger push lower is likely as long as price respects the previous top.
The analysis has been done with the indicators and template from the SWAT method (simple wave analysis and trading). For more daily technical and wave analysis and updates, sign-up to our newsletter.
Good trading,
Chris Svorcik


Leave a Reply