🎯 DAX 30 Bullish Chart Pattern Aims at Fib Targets 🎯

Dear traders,
the EUR/USD showed a massive bullish price swing last week. The bulls were even able to reach the Wizz 8 level.
Can we expect an uptrend to continue? Let’s review the key price patterns and the path of least resistance.
Price Charts and Technical Analysis
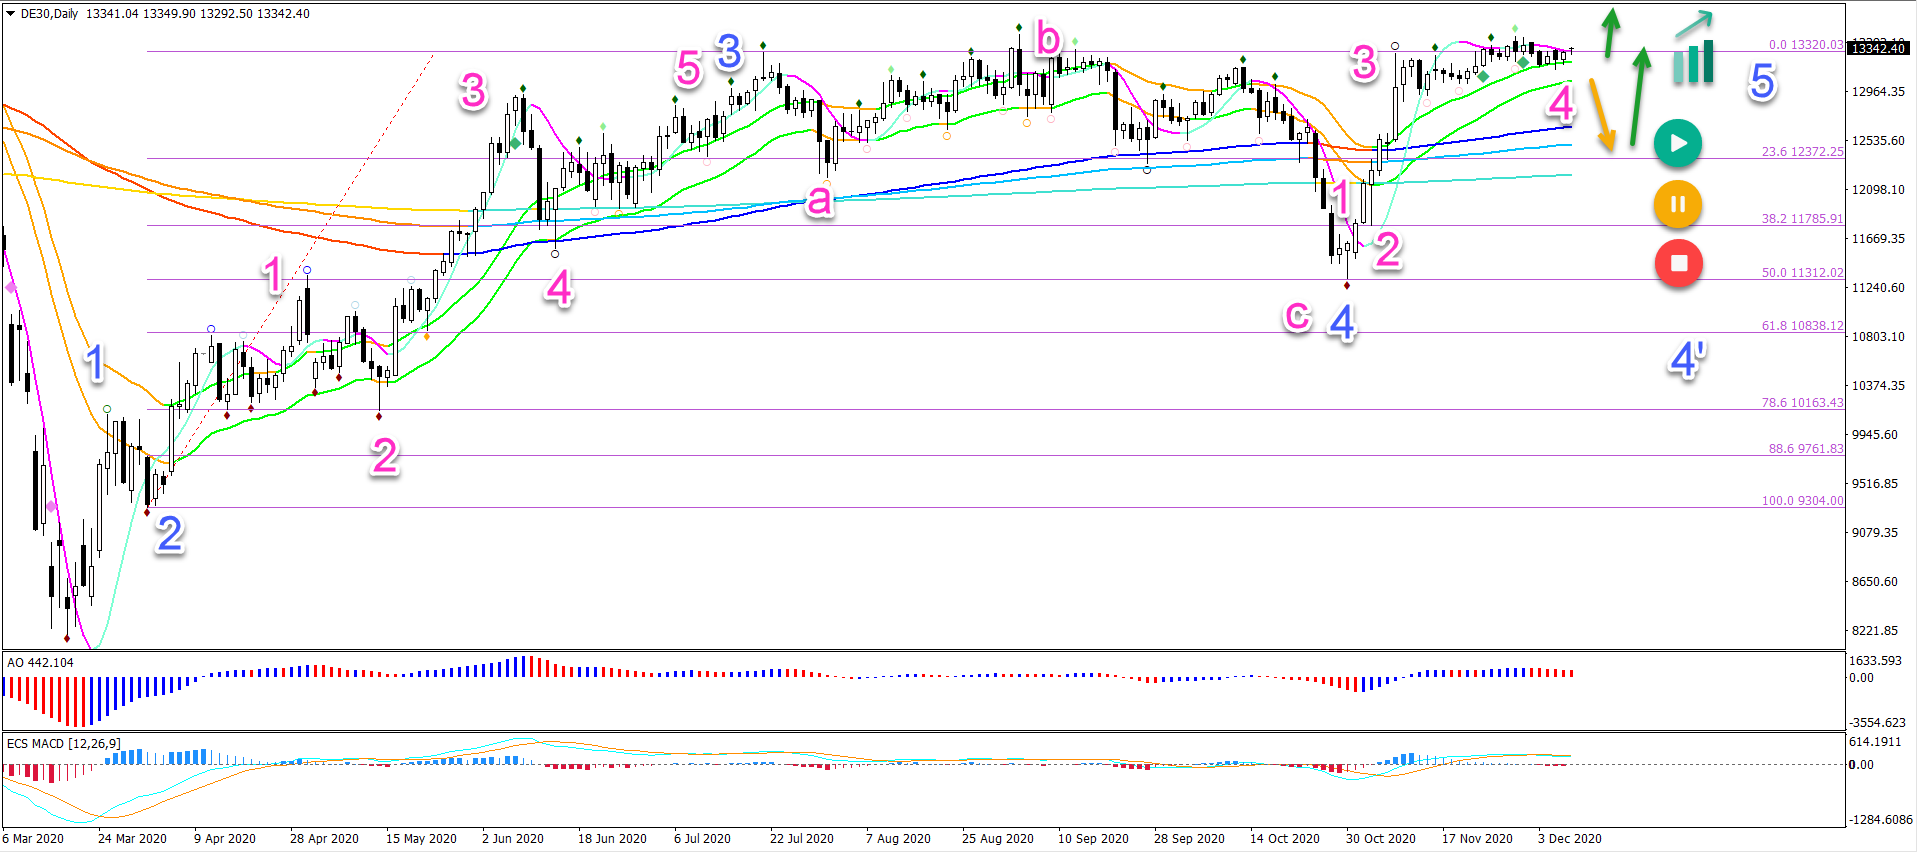
The DAX 30 seems to have completed an ABC (pink) pattern within the wave 4 (blue) at the 50% Fibonacci level.
The bullish bounce suggests that price action is now in a wave 5 (blue):
- A bullish breakout (green arrow) would confirm the uptrend continuation.
- Also a shallow pullback (orange arrow) and bounce (green arrow) confirms an uptrend.
- Only a deeper retracement (yellow-red) indicates that the wave 4 (blue 4’) is still ongoing.
The bullish targets are aligned at 13,700 and 14,250.
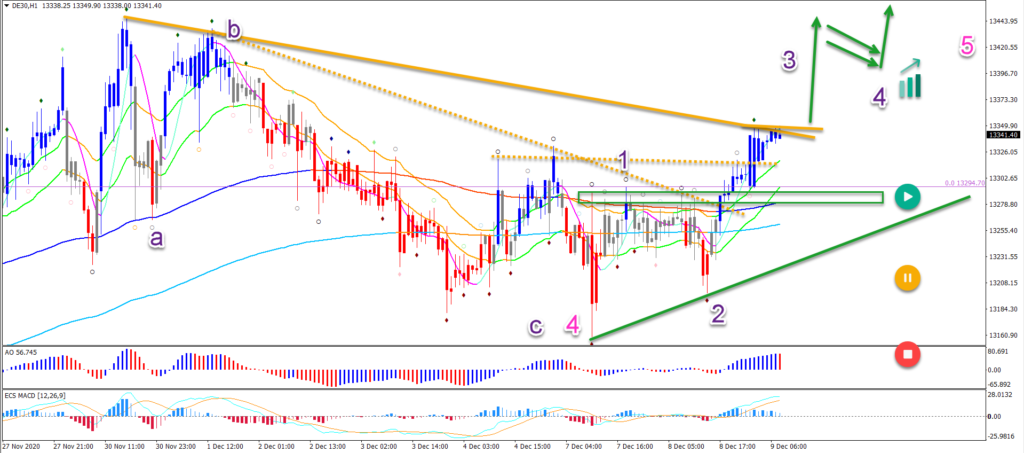
On the 1 hour chart, we see that the wave 4 (pink) of a lower degree seems completed at the recent low. Price action is building bullish momentum as it breaks above the long-term moving averages and trend lines.
The final push above the last resistance trend line could create a strong surge upwards. Because this price swing is likely a wave 3 (purple).
Eventually, a pullback within wave 4 should occur. This could be, for instance, a triangle pattern or bull flag pattern.
The analysis has been done with the indicators and template from the SWAT method (simple wave analysis and trading). For more daily technical and wave analysis and updates, sign-up to our newsletter.
Good trading,
Chris Svorcik


Leave a Reply