AUD/USD Double Bullish Breakout Offers Space to 0.83
Subscribe
Dear Trader,
Are you curious whether the AUD/USD is bullish or bearish?
In today’s article we will cover the Elliott Wave (EW) scenario for the Aussie Dollar.
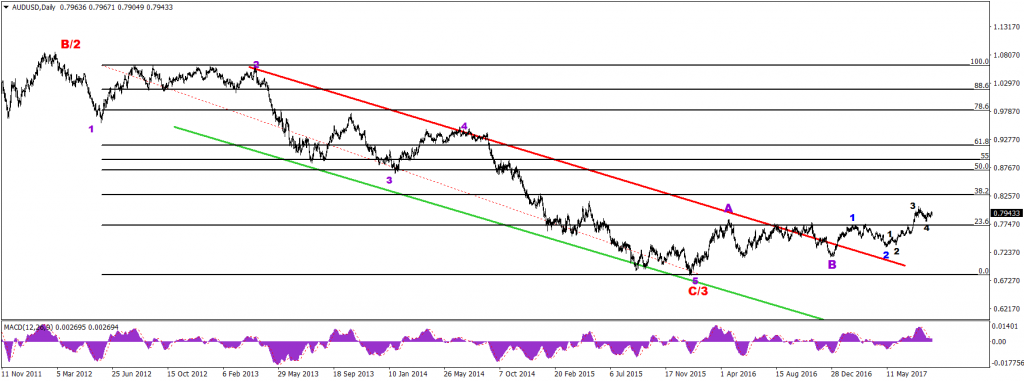
DAILY CHART: Broken Trend Line Resistance
The golden rule for the understanding of market with the help of EW is by starting with higher time frames. So let’s start with the daily chart first.
First we need to review some important points, which may help us in seeing trading opportunity:
- The wave pattern could either be 2&3 (red) or a B&C (red).
- Now there is a potential ABC zigzag (purple).
- Price is expected to respect the 38.2% and 50%.
The price broke above the resistance of the bearish channel and has managed to build a bullish run. Price also broke above the 23.6% level and is heading towards the 38.2% level. There is a fair chance that price may end wave 5 (black) around this 38.2% resistance Fib level (0.8297). If this proves to be valid, the end of wave 5 (black) may become part of a larger wave 3 (blue) and price could then move towards the 50-61.8% Fib area.

Image Daily Chart AUD/USD
4Hr CHART: Strong Bullish Outlook after 2nd Bullish Break
The price has developed very strong bullish wave structure in the medium term after breaking out of the long term bearish channel. Now price is in corrective mode and the main question is how far can price retrace in this correction? The answer can be found by drawing a Fibonacci retracement tool from wave 2 (black) to wave 3 (black). The price can potentially retrace down via an ABC correction (usually not more than the 61.8% Fib retracement level). After which price may start another bullish leg.
The wave 4 however could also be completed and the current bullish price action could be a slow and choppy start of the wave 5. For this to become more likely, price would need to break above 0.80 and the previous top.
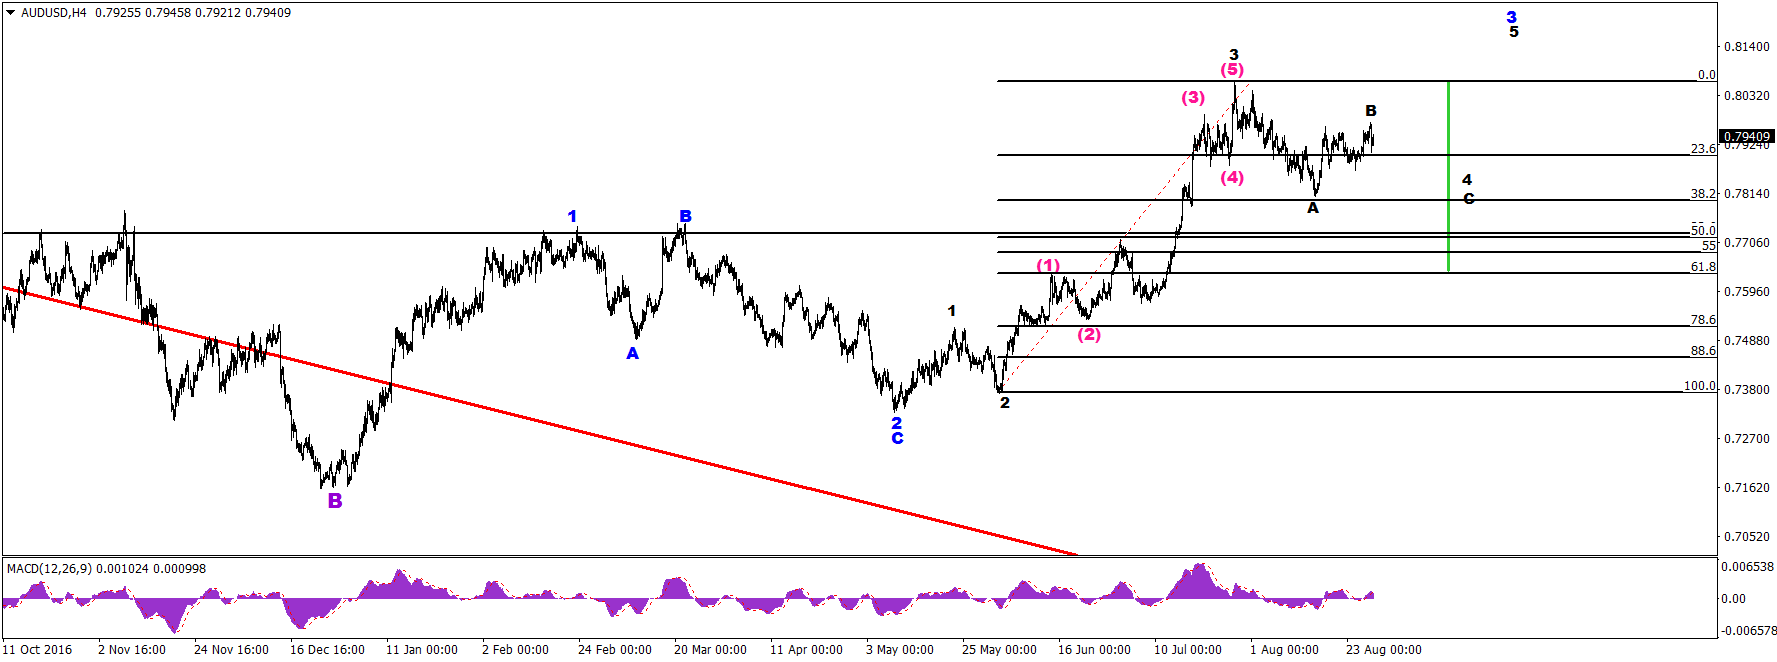
Image 4Hr Chart AUD/USD
Many green pips,
Elite CurrenSea team
More info on our ecs.SWAT course and trading system
Twitter: @EliteCurrenSea
YouTube: Elite CurrenSea


Leave a Reply