AUD/NZD – Bearish Pressure Could Target 1.03
Subscribe
Dear Traders,
The AUD/NZD is developing an interesting price structure that could provide good trading opportunities in the near future.
The analysis will highlight the overall price action of this fx pair and point out potential trade setups.
Wave Analysis Points Towards Downside Pressure
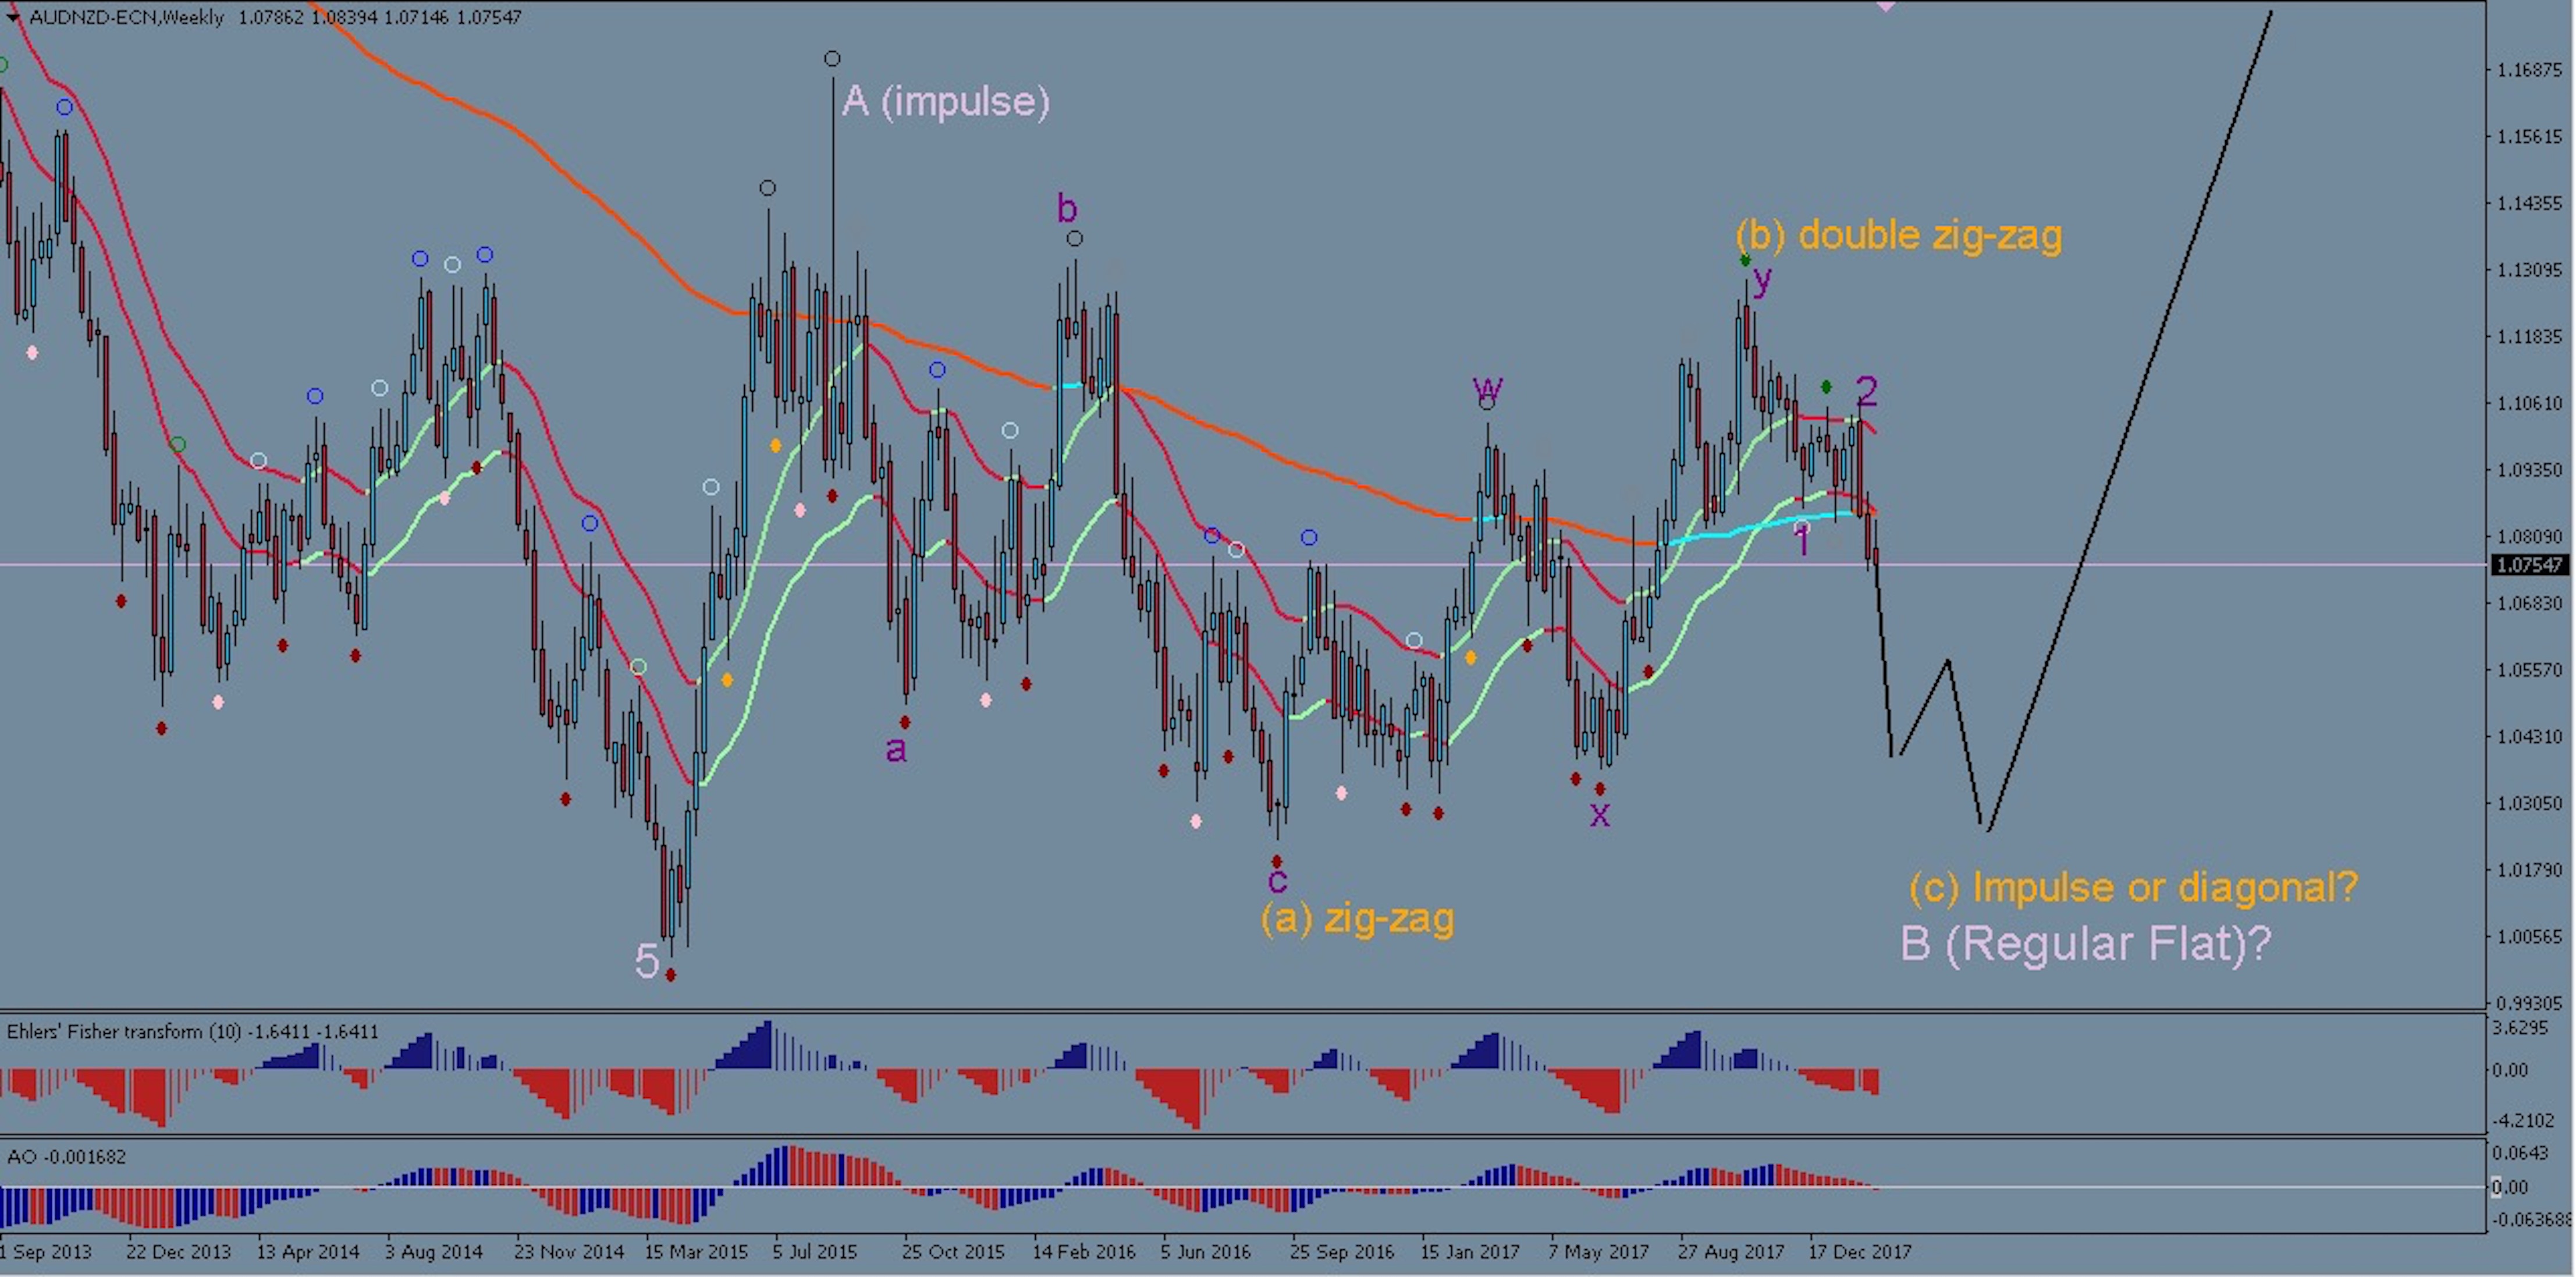
I have revised my long-term wave analysis, which i published some months ago, to the above wave count. The corrective price structure since the March 2015 fits so far best into the rules for a very large zig-zig (pale pink A-B, with C yet to come). We now appear to be entering the last phase of pale pink wave B, which should be an impulsive bearish move.
The main support for this bearish forecast is the internal wave structure of pale pink wave B, which fits perfectly into a 3-3-5 Flat pattern (orange ABC). The last leg of the Flat needs to be a strong 5-wave impulse, which appears to be indeed developing since the high of 2017. A strong Wave 3 downwards should commence very soon.
Trade Setups
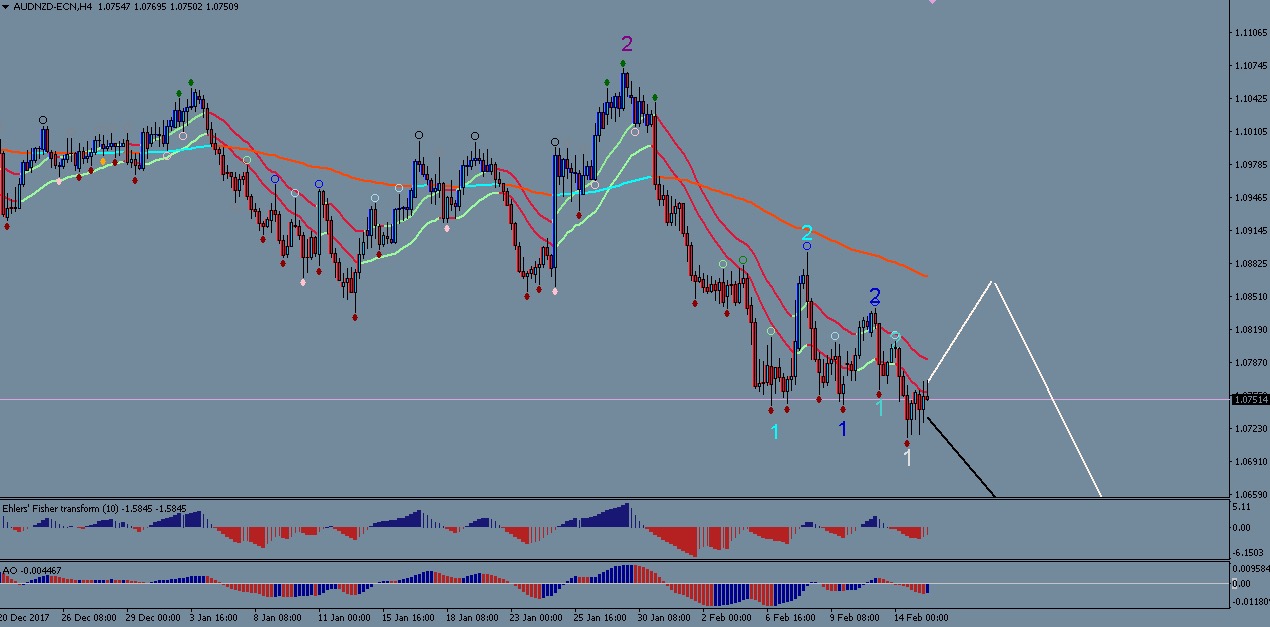
The 4 hour chart shows that the one of two scenario is currently playing out:
- Either price will begin to fall from current levels very quickly (black lines)
- Price could make one more impulsive move up to 1.08 before the fall begins in full force(white lines). This would mean the blue and white 1-2 labels are incorrect.
Here is what we are looking for:
A strong bearish candle close that breaks fully below the 21 EMA band (SWAT template) and closes very near the low, could be an early confirmation that option 1 is more likely. A bullish 4 hour candle close that challenges the previous 4 hour high would make option 2 more likely.
In any case, the target area for the bearish move could be between 1.03 and 1.02 which comes close to the beginning of Wave A which is normal for Flat Wave Patterns.
All the best along your trading journey
Hubert
.


Leave a Reply