❗️ Bitcoin’s Weekend Decline Finds Support at Shallow Fibonacci Levels ❗️


Dear traders,
the Bitcoin (BTC/USD) made a strong decline during the weekend. The price drop occurred after breaking the 60k resistance last week and reaching the first $65k target.
Although the bearish correction was impulsive, this article will analyse why the uptrend still has better odds than a reversal. Let’s start.
Price Charts and Technical Analysis
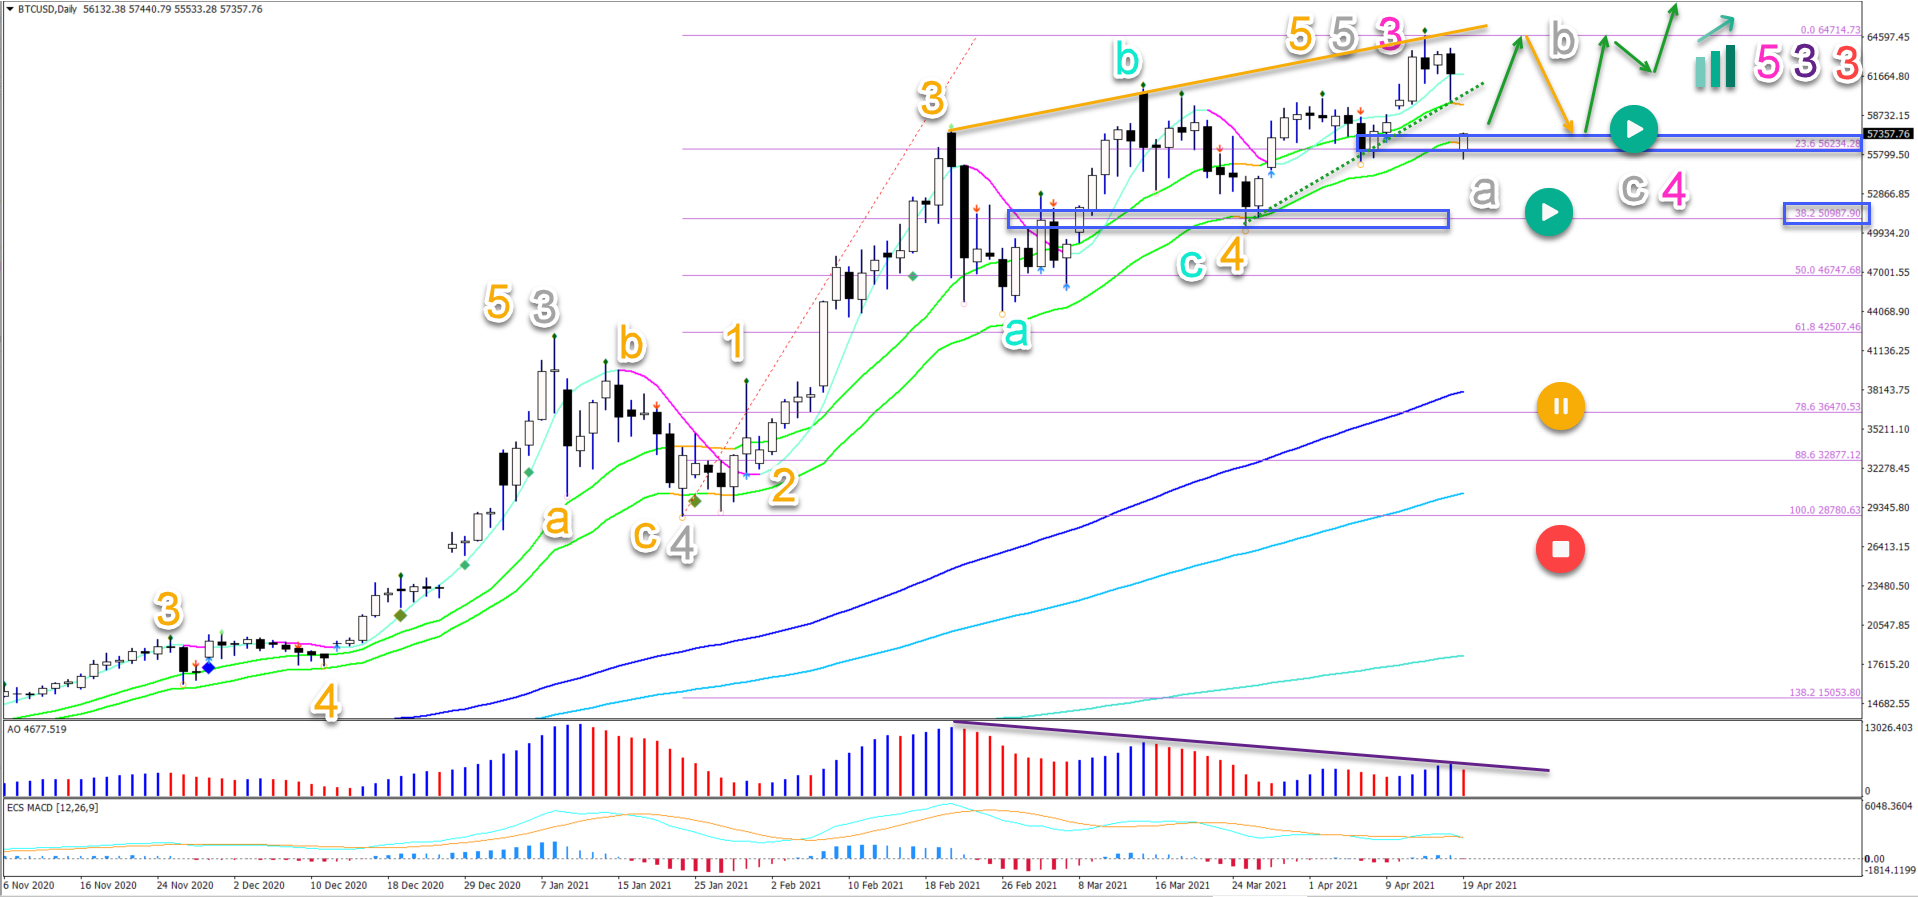
The BTC/USD completed the wave 4 (orange) as mentioned last time. We considered the next push up as a wave 5 (orange):
- This wave 5 did not move up that far and high, but it is quite normal for the uptrend to lose some momentum in a wave 5 (purple line in the AO). There was a small rising wedge pattern that probably supported the slow move up.
- The wave 5 (orange) of wave 5 (grey) probably completed a larger wave 3 (pink). The wave 3 is showing overall a lot of momentum (strong AO bars).
- The bearish correction, even though price dropped a lot during the weekend, does not change the overall uptrend because price action is respecting the shallow 23.6 and 38.2% Fibonacci retracement levels (blue boxes).
- The bounce at the Fibs is typical for a wave 4 (pink). Another correction could take place via an ABC (grey) pattern.
- The first breakout above the 21 ema zone is therefore risky because price could make a higher low first. But a 2nd breakout above the 21 ema zone and the 60-62.5k resistance zone followed by the top at 65k should create another strong push up later in April, May or June.
- The next targets are located at the round levels of $70k, $75k, and even $100k.
- A break below the support at 50k would certainly place the uptrend on hold and perhaps even indicate an early end.
On the 4 hour chart, we can see the bearish correction took price action from the top of the channel back down to the bottom of the channel and the long-term moving averages:
- A bullish bounce could indicate that the bearish decline is just a correction.
- The uptrend, however, might take a small pause as price action creates a potential wave 4 (pink).
- A retest of the previous top and bearish bounce could indicate a wave B (grey). An ABC (orange) correction could emerge within wave B (grey).
- If there is a 5 wave pattern moving up, then the uptrend might be immediately taking place.
- A retest of the support trend line could take place within wave B (orange) and after wave C (grey).This could indicate the end of the correction.

The analysis has been done with the indicators and template from the SWAT method (simple wave analysis and trading). For more daily technical and wave analysis and updates, sign-up to our newsletter.
Good trading,
Chris Svorcik


Leave a Reply