🏁 EUR/USD Ascending Wedge Chart Pattern in Final Wave 5 🏁

Dear traders,
the EUR/USD is building an ascending wedge chart pattern. A breakout indicates one more push higher as part of wave 5 (orange) of wave A (grey).
Let’s review the bullish pattern, the expected targets, and when should the bears retake back control.
Price Charts and Technical Analysis
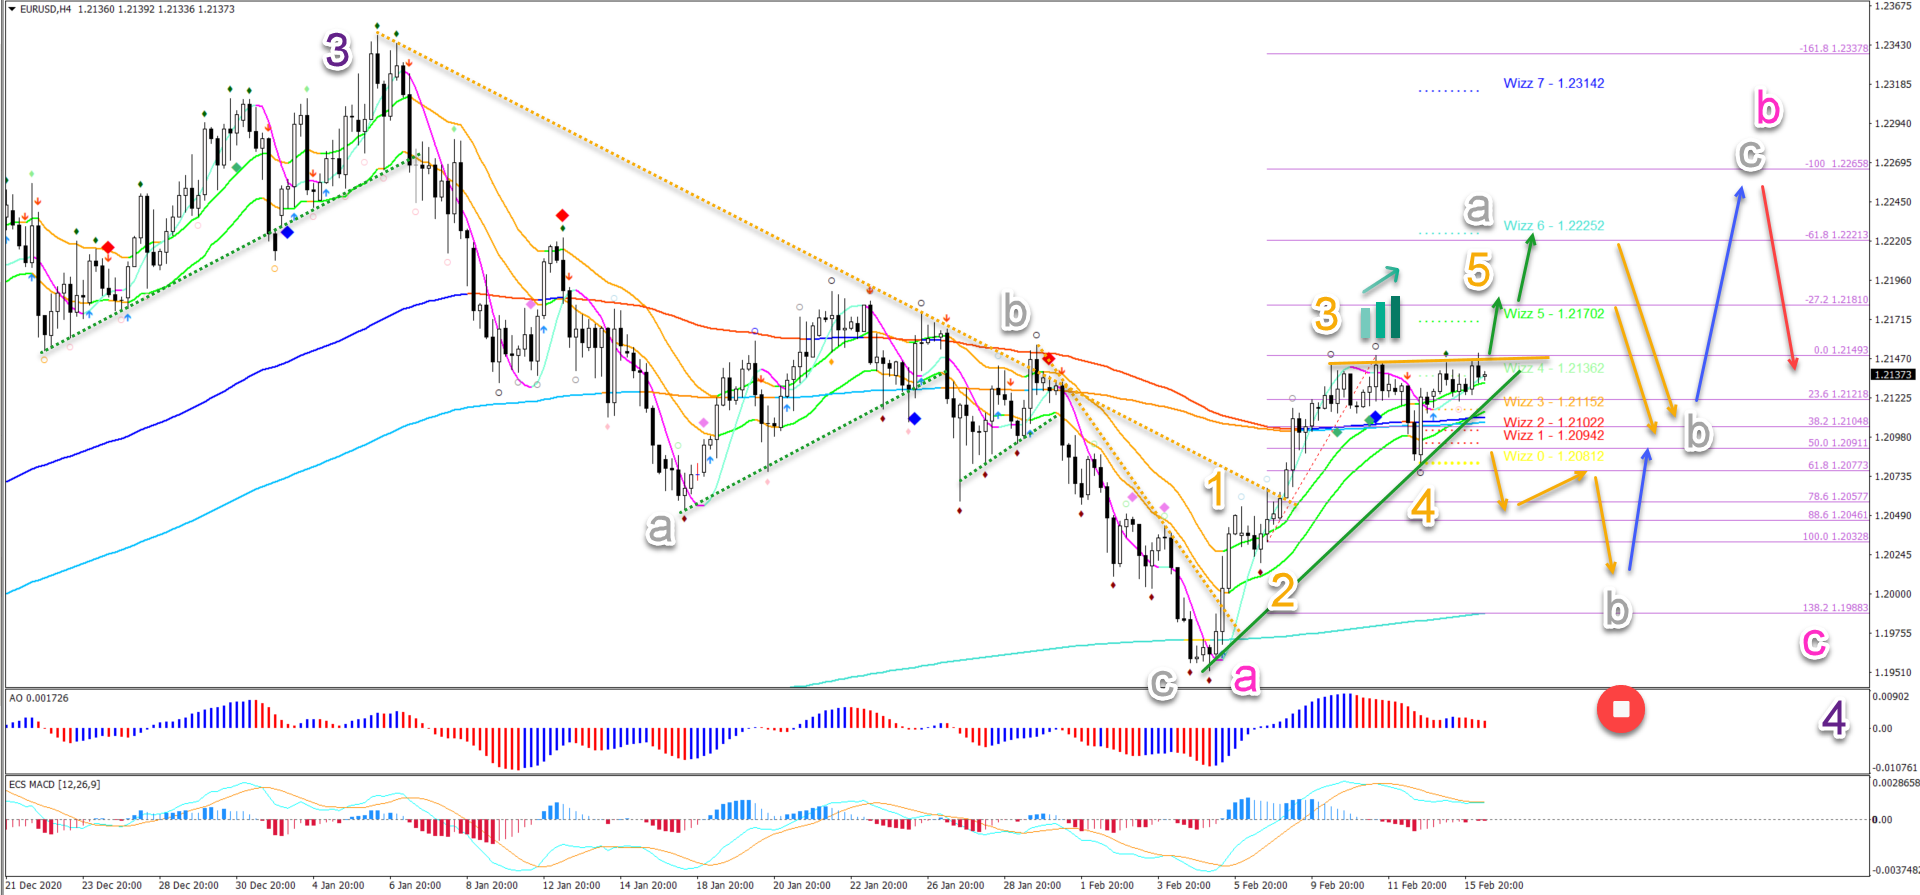
The EUR/USD break above the 144 ema was impulsive. This is typical for a wave 3 (orange) pattern.
This was the main reason why we expected a shallow and choppy wave 4 (orange). The correction did indeed bounce at the 50-61.8% Fibonacci support zone.
Here are the main scenarios:
- Price action is now testing the resistance trend line (orange)
- A bullish breakout (green arrows) is needed to confirm the upside
- The main targets are the Wizz levels at 1.12175 and 1.2225. Although price action could even retest the top.
- A bearish bounce (orange arrows) could take place at the targets as price action finishes wave A and retraces for wave B (grey).
- A bullish bounce (blue arrow) should create a wave C (grey) within wave B (pink) and more downside (red arrow).
- An immediate bearish breakout means that the wave 5 (grey) has already been completed and price action is in a wave B (grey) as long as price stays above the bottom (red circle).
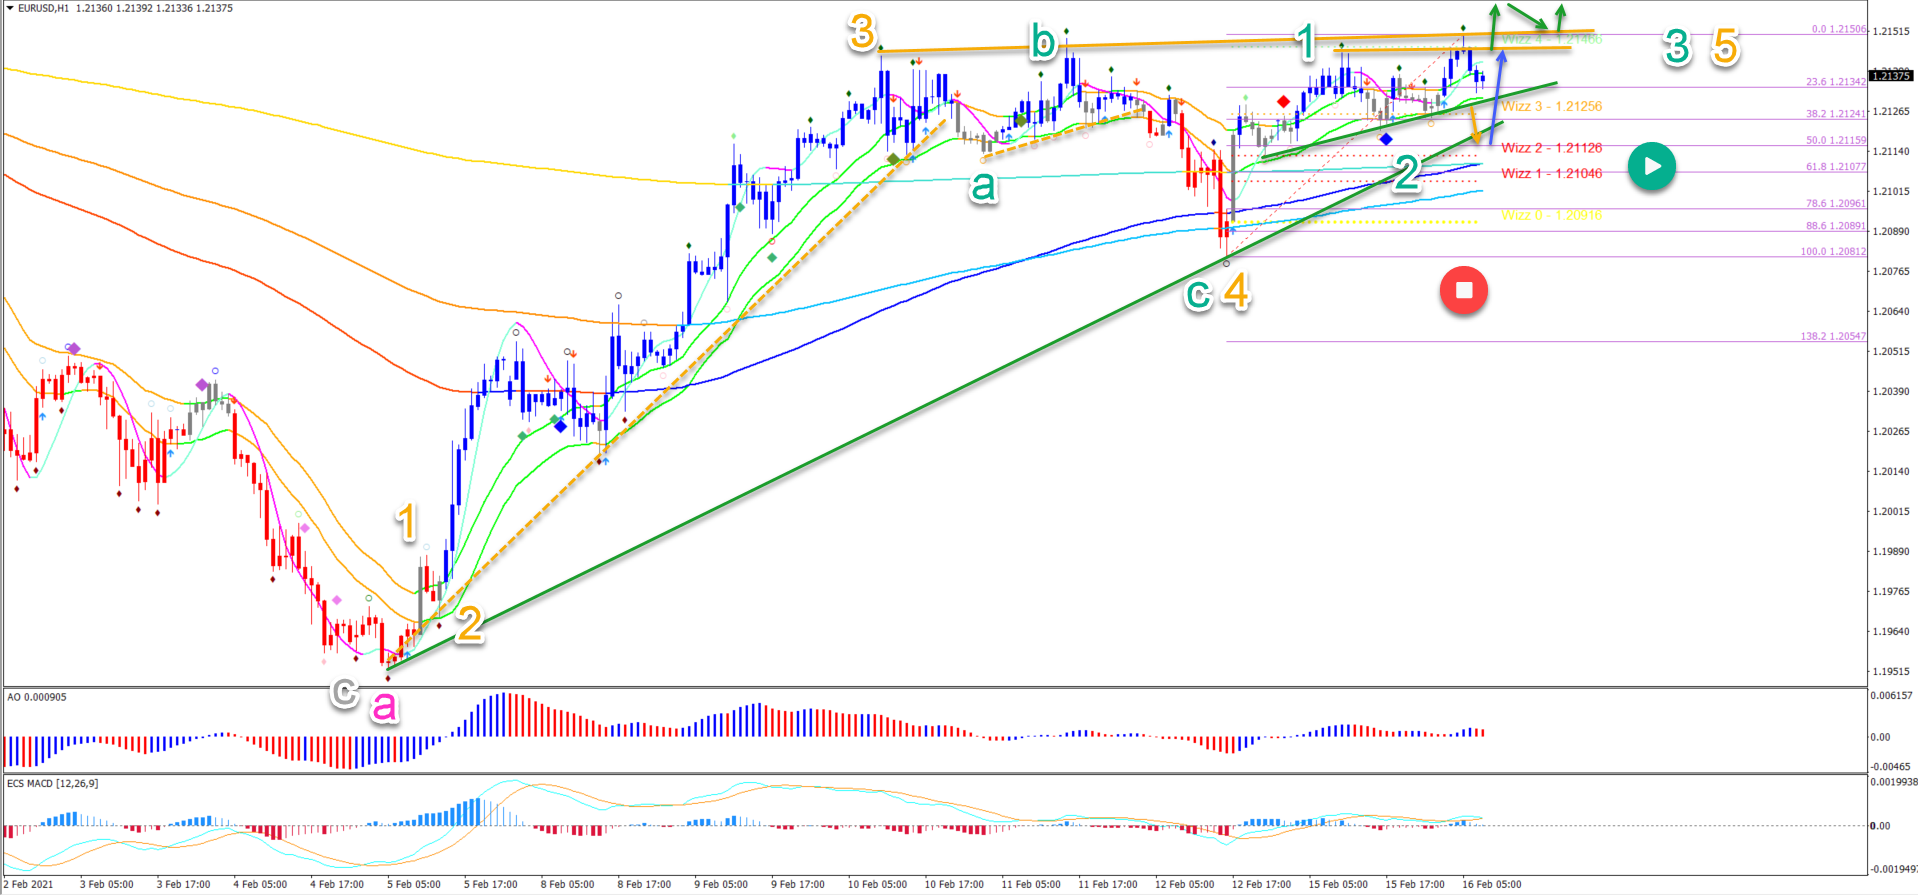
On the 1 hour chart, we can see the ABC (green) pattern within potential wave 4 (orange). Now price action could be ready for one more push up in wave 5 (orange).
Price action can either break immediately or first make a pullback to test the Fibonacci support levels. Both scenarios are bullish. This remains valid as long as price action stays above the bottom of wave 4 (orange).
The analysis has been done with the indicators and template from the SWAT method (simple wave analysis and trading). For more daily technical and wave analysis and updates, sign-up to our newsletter.
Good trading,
Chris Svorcik


Leave a Reply