? USD/JPY Prepares for 5 Bearish Waves Aiming at 107.80 ?
Subscribe
Hi traders,
the USD/JPY made a bearish bounce at the previous top and has broken below the support trend line (dotted blue), which could indicate a bearish correction back to the previous bottom.
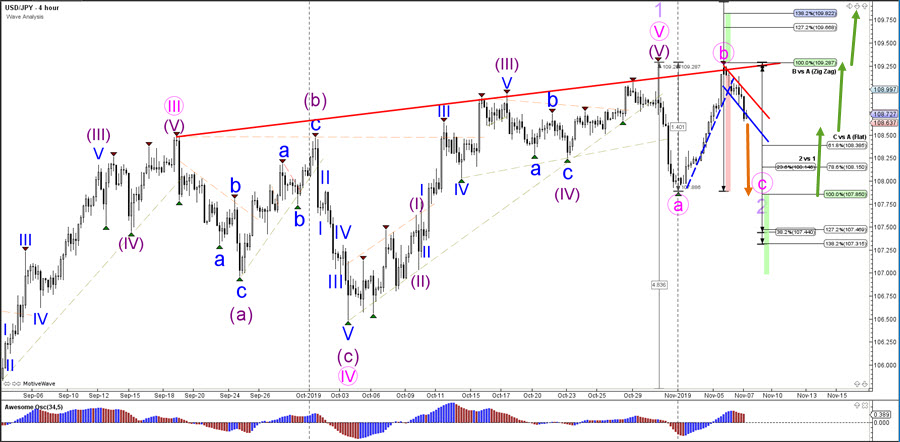
USD/JPY
4 hour
The USD/JPY could be building a bearish ABC (pink) correction pattern as long as price stays below the 138.2% Fibonacci level of wave B vs A. A break below the support trend line (blue) confirms a larger wave C (pink) and is likely to aim at the previous bottom (orange arrow), which could be a bouncing a spot (green arrows).
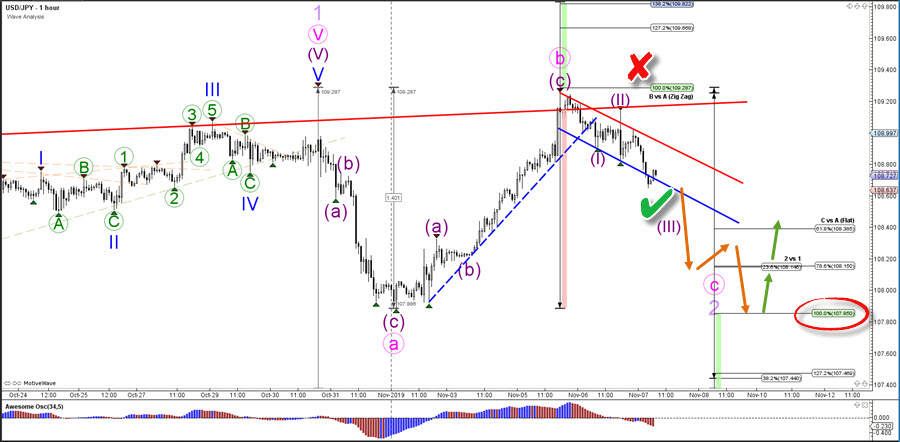
1 hour
The USD/JPY seems to have completed a bullish ABC (purple) zigzag pattern at the previous high. The current bearish price action could indicate a 5 wave pattern in an ABC flat correction (pink) if price manages to break (green check) support and stay below resistance (red x). The main target is the 100% Fibonacci level of wave C vs A.
For more daily wave analysis and updates, sign-up up to our ecs.LIVE channel.
Good trading,
Chris Svorcik
Elite CurrenSea


Leave a Reply