? GBP/USD Bullish Bounce Favors Wave 4 Pullback and Uptrend ?
Subscribe
Hi traders,
the GBP/USD made a bullish bounce at the support trend line (blue) and the 23.6% Fibonacci retracement level of wave 4 vs 3. The shallow correction could indicate a pullback within the uptrend rather than a bearish reversal.
GBP/USD
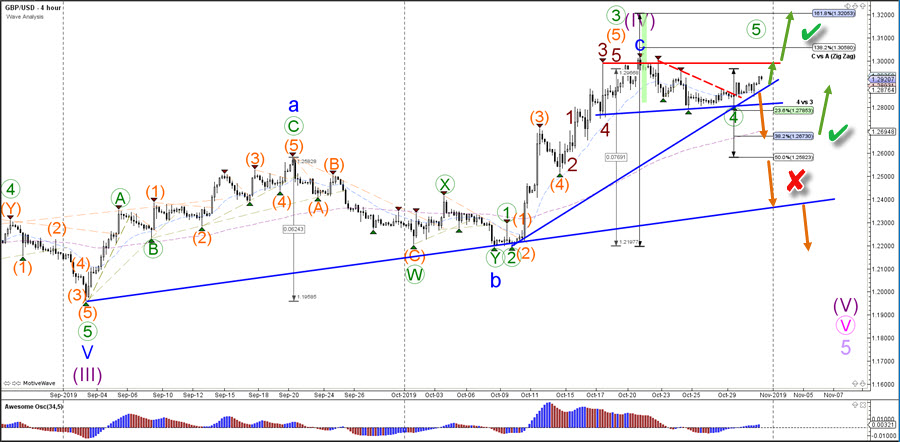
4 hour
The GBP/USD seemed like it was completing a bullish ABC (blue) zigzag pattern within the wave 4 (purple) but the current corrective price action is not confirming any bearish reversal. In fact, the choppy price behavior is typical for a wave 4 (green) pattern and a bullish breakout above the round resistance level of 1.30 could indicate (green check) a wave 5 (green). A break below the 50% Fibonacci level invalidates (red x) this wave 4-5 (green).
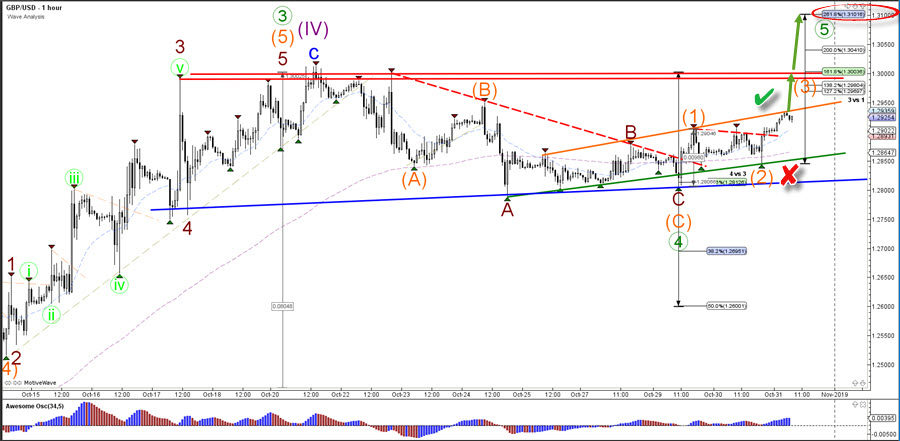
1 hour
The GBP/USD made a bullish bounce at the support zone, which could indicate a wave 1-2 (orange) pattern if price manages to stay (red x) above the support line (green). A bullish breakout (green check) could confirm the bullish wave 3 (orange) towards the Fibonacci targets of wave 3 vs 1.
For more daily wave analysis and updates, sign-up up to our ecs.LIVE channel.
Good trading,
Chris Svorcik
Elite CurrenSea


Leave a Reply