? USD/JPY Break of Triangle Pattern Aims at 106 Support ?
Subscribe
Hi traders,
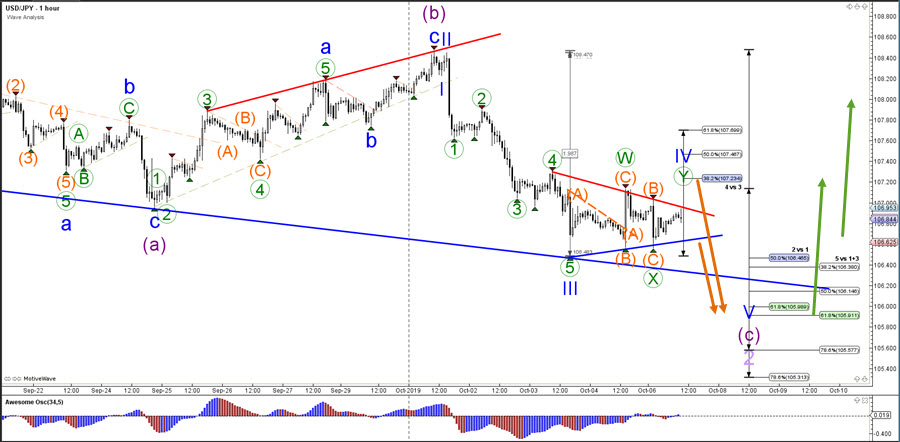
the USD/JPY is showing bearish momentum, which is probably a wave C (purple) retracement of a larger wave 2 (light purple) correction.
USD/JPY
4 hour
The USD/JPY seems to be completing a bearish ABC (purple) pattern after 5 bullish waves up (pink). made a bullish bounce at the 50% Fibonacci retracement level, which could already could indicate the end of the wave 2 (light purple) if price is able to break above the resistance zone (red). A bearish breakout below support (blue) could indicate a deeper retracement towards the 61.8% Fibonacci level of wave 2 vs 1.

1 hour
The USD/JPY seems to be completing a contracting triangle within wave 4 (blue) vs 3 as long as price stays below the 61.8% Fibonacci level of wave 4 vs 3. A break below the triangle could indicate a push lower towards the 61.8% Fib of wave 2 vs 1, which in turn is expected to be a bouncing spot.
For more daily wave analysis and updates, sign-up up to our ecs.LIVE channel.
Good trading,
Chris Svorcik Elite CurrenSea


Leave a Reply