? AUD/USD Non-Stop Downtrend Aims at 0.65 After Pullback ?
Subscribe
Hi traders,
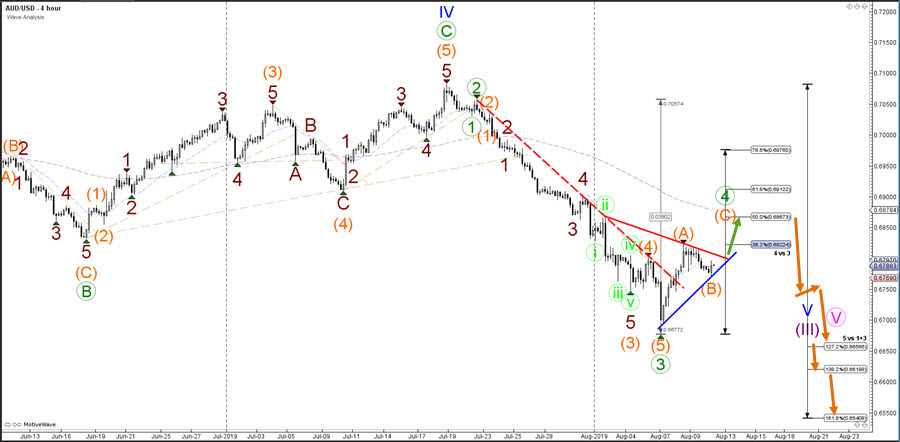
the AUD/USD break below the support zone (green) is running into problems and a bullish retracement seems to be taking price back to the critical Fibonacci resistance levels of wave 4 vs 3.
AUD/USD
Daily
The AUD/USD bearish bounce at the 38.2% or 50% Fibonacci retracement levels could indicate a continuation of the downtrend. The downtrend will probably aim at the Fibonacci targets of wave 5 vs 1+3 whereas a bullish breakout above the 50% Fib makes the current wave 4 (green) pattern less likely.

4 hour
The AUD/USD seems to be building a bullish ABC (orange) pattern within wave 4 (green). A break above the resistance trend line (red) could indicate a push towards the 50% Fibonacci whereas a break below the support trend line (red) could indicate a deeper wave B (orange) or downtrend.
For more daily wave analysis and updates, sign-up up to our ecs.LIVE channel.
Good trading,
Chris Svorcik
Elite CurrenSea


Leave a Reply