? GBP/USD Struggles to Break 1.21 Despite Classic Bear Flag ?
Subscribe
Hi traders,
the GBP/USD tried to break the support line (dotted blue) of the bear flag chart pattern but price quickly reverted back up again. Can the Cable continue lower?
GBP/USD
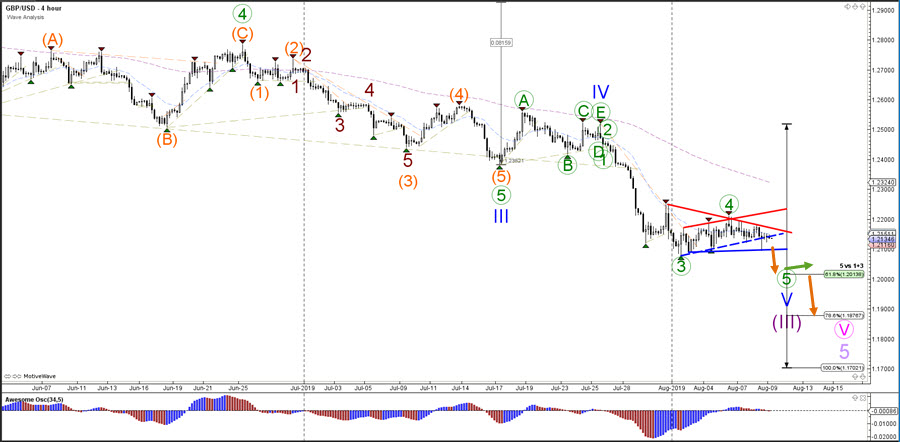
4 hour
The GBP/USD is building a classical corrective bear flag pattern after a strong and impulsive bearish price swing from 1.25 to 1.21. The consolidation zone usually indicates a continuation lower. A break below 1.21 could indicate the start of the wave 5 (green) and the price is likely to aim at or close to the round level of 1.20.
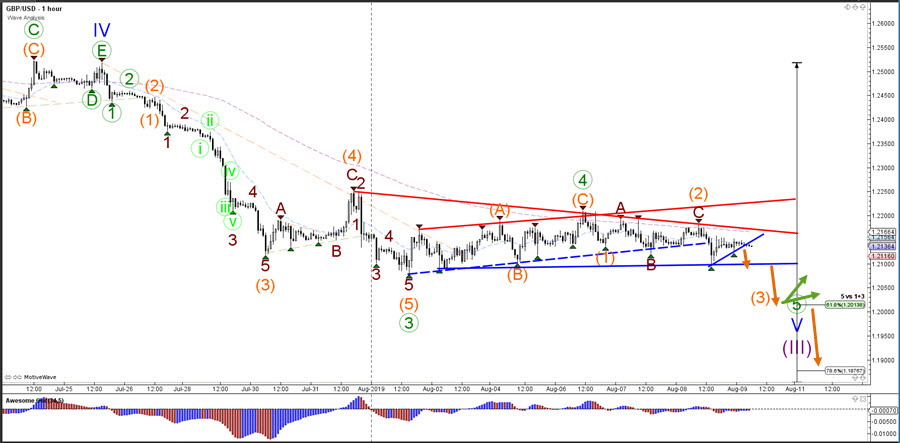
1 hour
The GBP/USD has made a couple of lower highs which could indicate a turn back into a downtrend. But the breakout remains fragile and uncertain and a push above the resistance trend lines could see price move up towards 1.2250 at first. A break below support could make it more likely that price can make a decline towards the 61.8% Fibonacci target.
For more daily wave analysis and updates, sign-up up to our ecs.LIVE channel.
Good trading,
Chris Svorcik
Elite CurrenSea


Leave a Reply