? AUD/USD Bullish Wave-C Faces Wave-4 Fib Resistance ?
Subscribe
Hi traders,
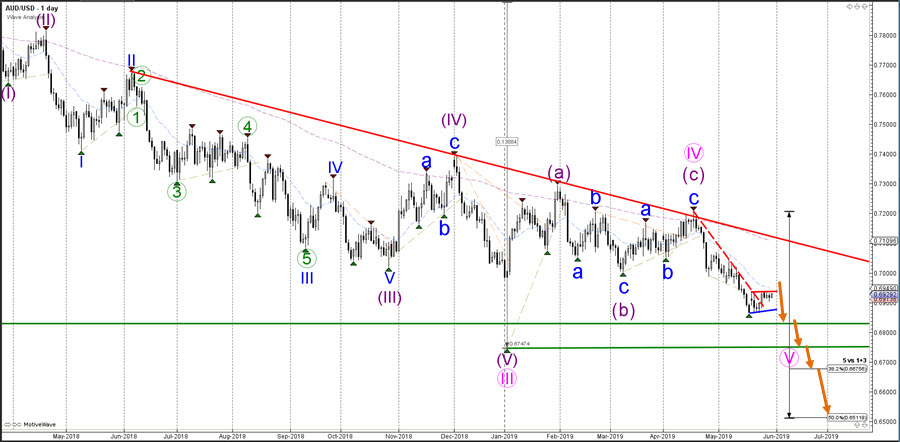
the AUD/USD seems to be building a bear flag chart pattern at the previous bottoms (green lines). A bearish break could indicate a large downtrend continuation.
For more daily updates check out ecs.LIVE service with live webinars, live trade setups, and live analysis.
AUD/USD
Daily
The AUD/USD is now challenging the resistance trend line (red) of the bear flag chart pattern. A bullish breakout is expected to be limit if the pattern is indeed a bear flag. A break below support (blue) could indicate the start of the downtrend.
4 hour
The AUD/USD seems to be building a bullish wave C (green) pattern within the wave 4 (blue). Usually price should stop and reverse at the Fibonacci retracement levels of wave 4 vs 3 such as the 23.6%, 38.2%, or 50% Fibs. A bearish bounce and bearish breakout would confirm this potential turnaround and the start of the wave 5 (blue) within wave 3 (purple).

For more daily wave analysis and updates, sign-up up to our ecs.LIVE channel.
Good trading,
Chris Svorcik
Elite CurrenSea


Leave a Reply