? USD/JPY Reversal Zone at Deep 88.6% Fibonacci Target ?
Subscribe
Hi traders,
The USD/JPY is approaching a key resistance trend line (orange) and 88.6% Fibonacci retracement level, which is a critical bounce or break spot. A bearish bounce is expected which could confirm a larger ABCDE (purple) triangle chart pattern.
USD/JPY
4 hour

The ABCDE (purple) triangle chart pattern could be part of a larger bearish ABC (pink) wave pattern.
1 hour
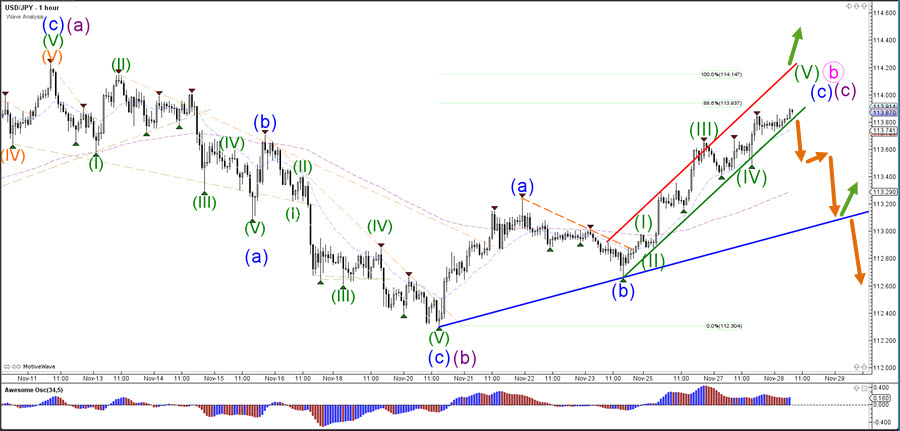
The USD/JPY is either showing a wave C (blue) as shown in the image or the alternative wave pattern for this bullish momentum could be a wave 3. A bearish bounce at the 88.6% Fib and break below the uptrend channel could indicate the end of the wave 5 (green) of wave C (blue) and the start of a bearish swing.
For more daily wave analysis and updates, sign-up up to our ecs.LIVE channel.
Good trading,
Chris Svorcik
Elite CurrenSea


Leave a Reply