☝️ XAU/USD Awaits Bearish Wave 5 Upon Triangle Break ☝️
Subscribe
Hi traders,
XAU/USD showed a strong bearish reaction at the resistance zone (red) but the price action has moved sideways ever since. Price now needs to break the trend lines before a new direction is known.
XAU/USD
4 hour
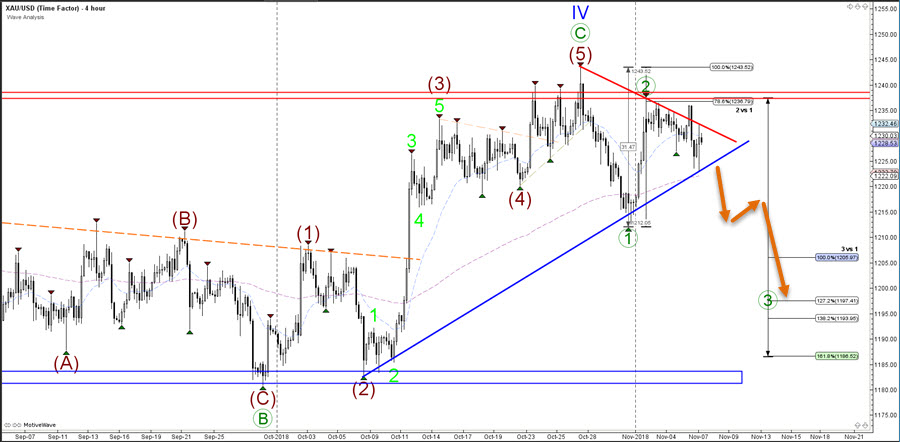
XAU/USD respected the 78.6% Fibonacci retracement level of wave 2 vs 1 (green) and reversed at the key level. A break above the 100% Fib invalidates the wave 1-2 (green) pattern whereas a break below the support trend line (blue) could confirm it.
Daily
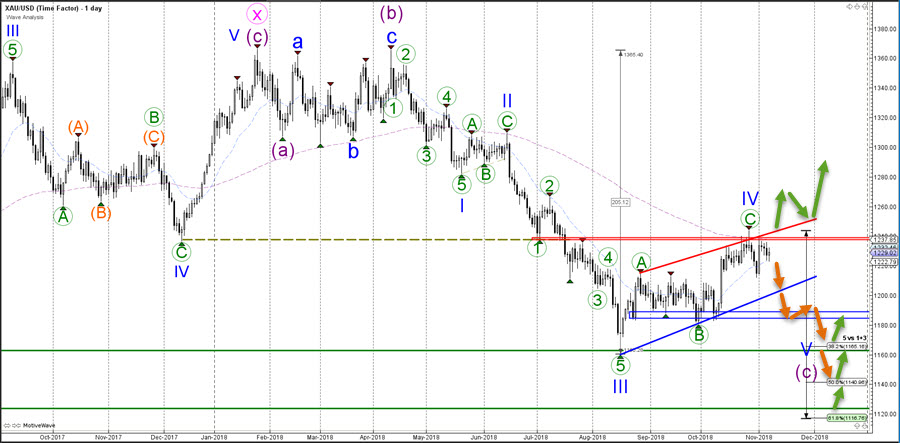
The bearish continuation is probably part of a final wave 5 (blue) of a larger wave C (purple). The downtrend could end in the support zone indicated by the green lines. A bullish break above the previous top and resistance zone (red) could indicate that the wave 4 (blue) pattern is not so likely and could lead to more upside if price builds a consolidation pattern after the bullish breakout.
For more daily wave analysis and updates, sign-up up to our ecs.LIVE channel.
Good trading,
Chris Svorcik
Elite CurrenSea


Leave a Reply