? USD/JPY Bull Flag Chart Pattern Awaits Bullish Breakout ?
September 18, 2018
2 min read
Subscribe
Hi traders,
The USD/JPY is building a bull flag chart pattern (purple lines). The break of the flag could indicate a bullish push up towards the 78.6% Fibonacci retracement near 112.50.
USD/JPY
4 hour
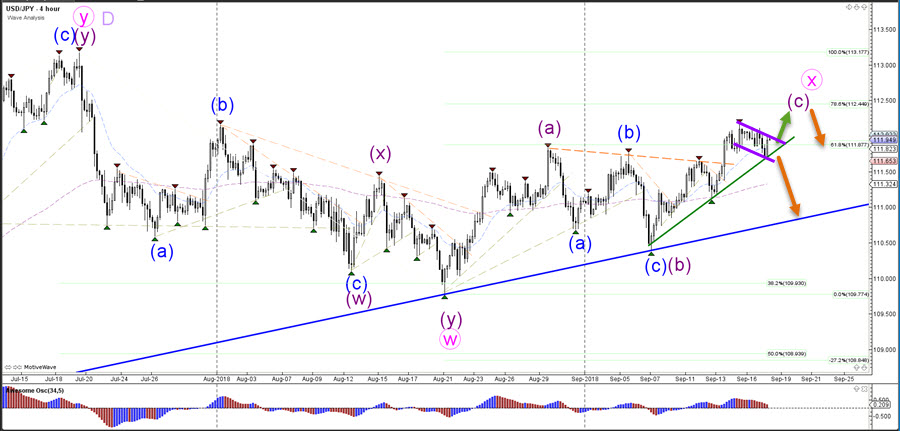
The USD/JPY will either bounce or break the 78.6% Fibonacci retracement level of wave X (pink). A break makes the wave X less likely whereas a bounce would confirm it.
1 hour
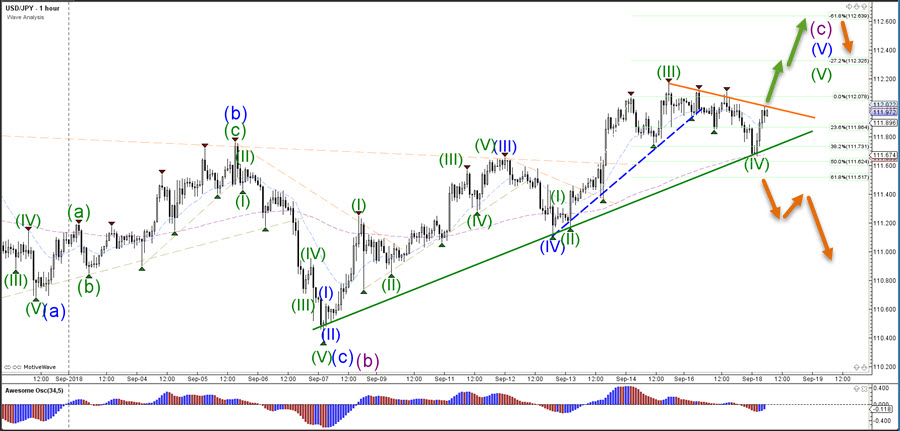
The USD/JPY needs to break above the resistance trend line (orange) before a continuation towards the Fibonacci target becomes more likely. The bull flag pattern remains intact as long as price stays above the support trend line (green) and Fibonacci retracement levels.
Good trading,
Chris Svorcik
Elite CurrenSea


Leave a Reply