❗️ Ripples (XRP/USD) Builds Impulsive Bearish Wave 3 ❗
Subscribe
Hi traders,
Ripples (XRP/USD) made a strong bearish breakout below the support trend line and descending wedge chart pattern as expected in our previous analysis on XRP/USD. The bearish breakout could indicate that a potential downtrend continuation towards the -72.2% Fibonacci target at 0.2379.
XRP/USD
Day
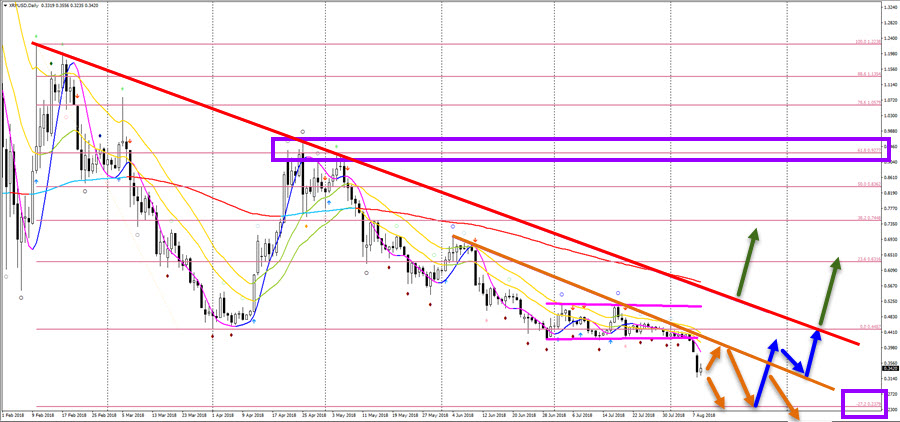
XRP/USD is in a sold downtrend and the weak and choppy bullish price action did not indicate that any bullish reversal was likely. The bearish breakout eventually did take place and price seems to be building a breakout, pullback and continuation.
4 hour
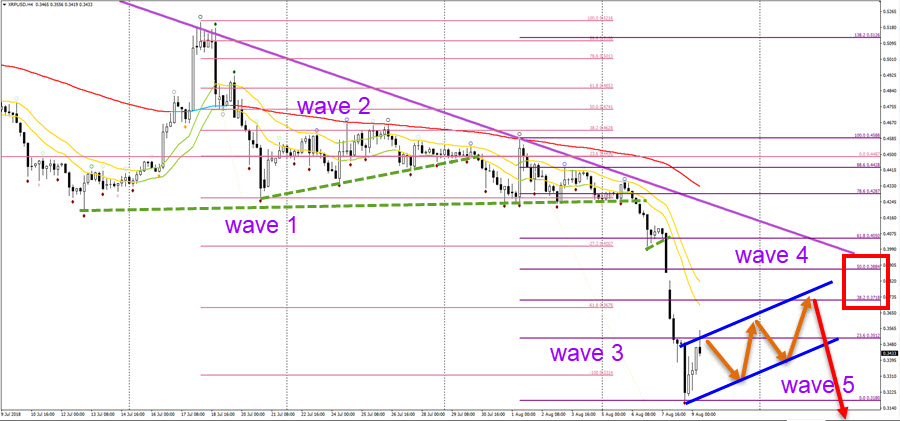
XRP/USD seems to have built a bearish wave 3 (purple). Price could still be in the wave 3 and extend it to lower lows but if price does build a correction, then this could be a wave 4 (purple). Waves 4 are usually shallow retracement and often create chart patterns. A bull flag chart pattern up to the 38.2% Fibonacci is the most likely scenario. A bearish bounce and breakout could confirm the wave 4-5 pattern.
Good trading,
Chris Svorcik
Elite CurrenSea


Leave a Reply