✅ BTC/USD Builds Head and Shoulders Reversal Chart Pattern ✅
Subscribe
Hi traders,
Bitcoin (BTC/USD) seems to be building a deep correction which could be part of a wave 2 (purple). The main question is whether price will complete that wave 2 anytime soon.
BTC/USD
Day
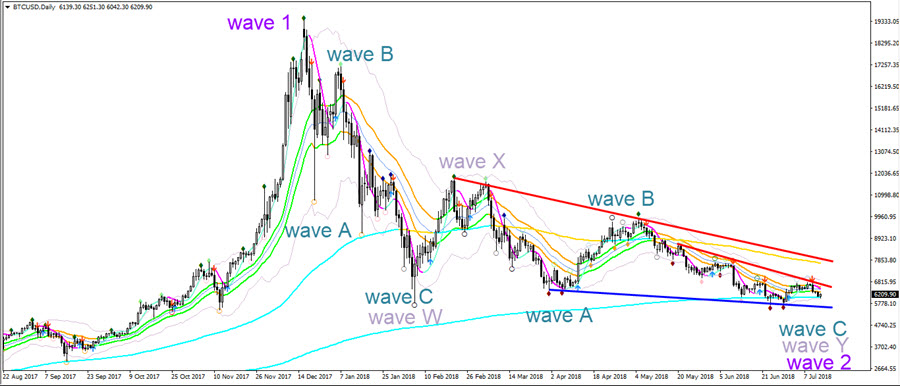
BTC/USD seems to be building a falling wedge chart pattern when assessing and analysing the angle of the support and resistance trend lines. Price is also challenging the long-term moving average. Price will need to break above resistance before a new uptrend is likely.
4 hour
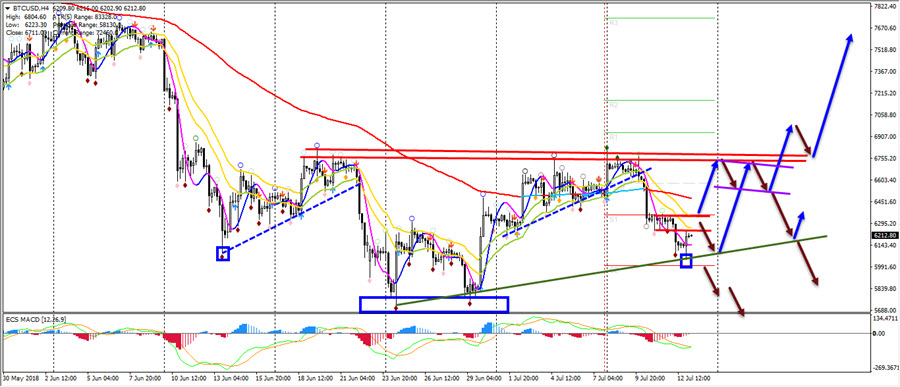
BTC/USD made a bearish bounce at the previous resistance zone. The current bearish price action is now testing key support levels such as the weekly S2 Pivot Point, the support trend line, and Fibonacci levels (not added to this chart). Price is also creating a potential head and shoulders reversal chart pattern, which is indicated by the blue boxes. The arrows in the chart indicate critical break or bounce decisions at key support and resistance zones.
Good trading,
Chris Svorcik
Elite CurrenSea


https://www.tradingview.com/chart/wS3iEb4Z/ Could this be the 3rd alternative? Very much support the WXY pattern. Tnx