EUR/USD Bearish Wave C ? GBP/USD Challenges 1.40 Support ✅
Subscribe
Hi traders,
the EUR/USD failed to break resistance and is now building bearish price action within a final leg of the bullish wave 4 correction.
EUR/USD
4 hour
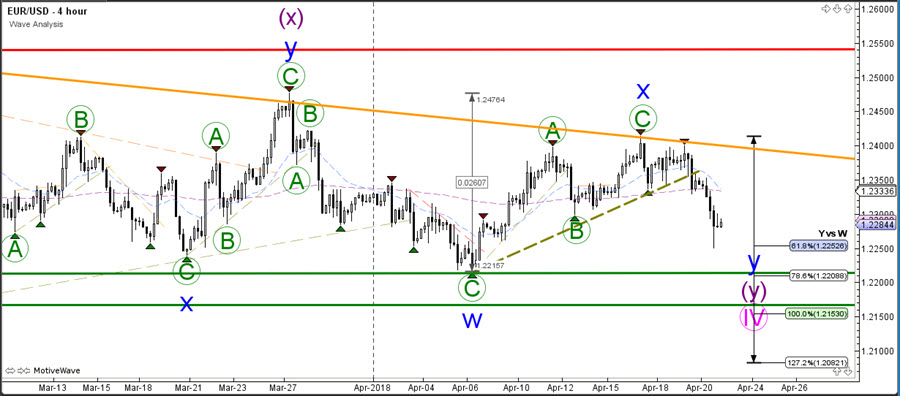
Rather than breaking resistance, price in fact broke below the support trend line (dotted green) and it is expanding the bearish correction via a WXY (blue) pattern. The wave 4 (pink) is therefore most likely still open but price could close to completing that wave structure at the support zone (green lines).
1 hour
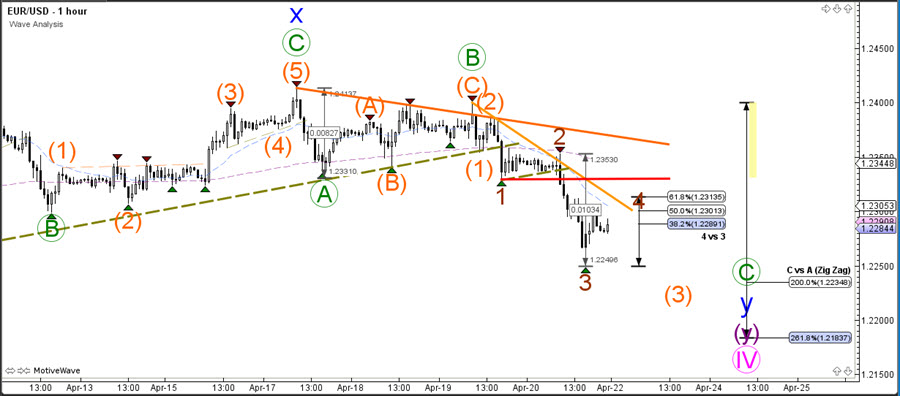
The EUR/USD broke multiple support lines and is building a bearish channel. Currently price could be in a bearish wave 4 (brown), as long as price stays below the 61.8% Fib and previous bottom (red line). There could be still one or even two more lower lows if price expands the 3rd wave (orange).
GBP/USD
4 hour
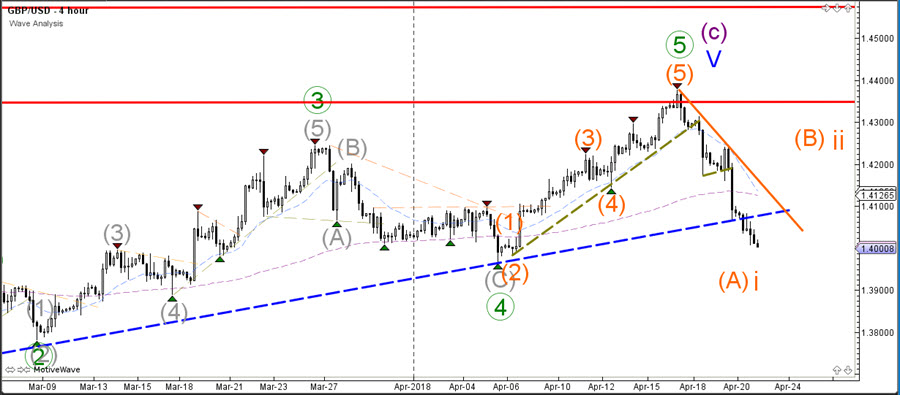
The GBP/USD bearish momentum could indicate the end of the bullish trend and the start of a new bearish reversal (wave 1-2) or ABC correction. The 1.40 round level is a potential support area which could create a bullish bounce as part of a wave 2 or B.
1 hour
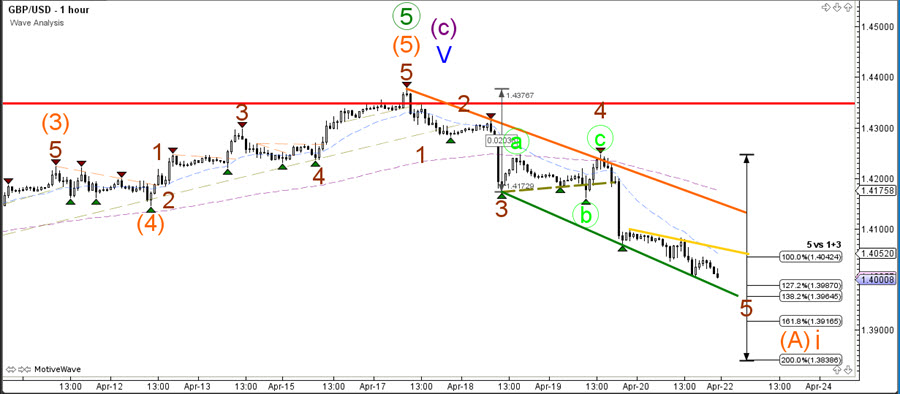
The GBP/USD is probably moving lower in a bearish wave 5 (brown). A bearish break below 1.40 could indicate an immediate bearish continuation for one more lower but eventually a bullish retracement is likely.
Good trading,
Chris Svorcik
Elite CurrenSea
.


Finally you see that EURUSD is in wave 4 ranging on the daily.. I’m glad. Please refer to my last comment.
Thanks John! Yes indeed, I actually mentioned it quite often in webinars but forgot to change it in the wave analysis because I am looking more at 1-4 hour charts and then forgot to update the bigger wave 4, sorry for that 🙂
Thanks Chris
I have used your last two analysis for my GBP/USD trades which have really helped me and got out of gold just in time.
Very happy to hear it! 🙂