✅ Weed Stocks Show Bearish Pullback in Overall Uptrend ✅
Subscribe
Dear Traders,
As most of you already probably know, our focus is mainly on the Forex markets, Gold, Oil, and recently on cryptocurrencies too.
This time around we wanted to share technical analysis and chart patterns of a different type of financial instruments: weed stocks.
Aurora Price Chart
Aurora is building a bearish retracement within a decent uptrend. Price is likely to test the support trend lines and the 50% Fibonacci level at around 10.70.
A second support zone is the 61.8% Fib and previous bottom (blue zone) at arund $9.50. A break below the 61.8% Fib makes it less likely that a wave 4 is taking place, which could indicate that a different wave pattern is unfolding than the one added in the chart below. The invalidation level if the top of wave 1.
A bullish bounce could see price make a wave 5 rally. It is critical, however, to see bullish candlestick patterns in the support zone, otherwise bearish candles break continue.

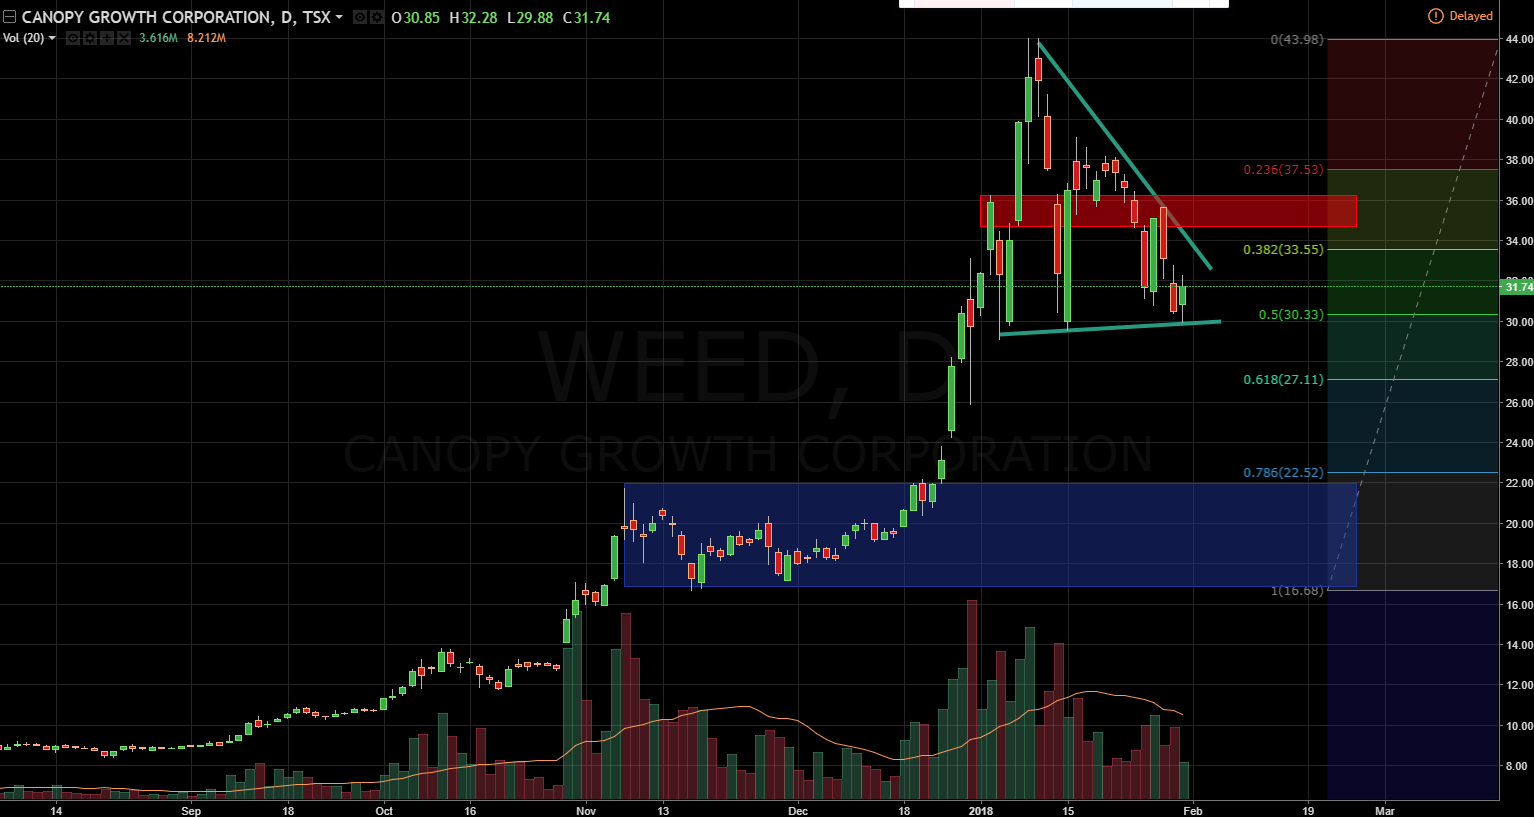
Canopy Price Chart
Canopy’s uptrend was strong but the retracement has been heavy as well. The triangle chart pattern is a good indication of what will happen next:
- A bullish breakout could indicate an uptrend continuation once price breaks above the resistance zone (red).
- A bearish breakout could see price test deeper Fib levels.
For the moment, a bearish breakout seems more likeley due to the potential bearish ABC pattern unfolding. The blue zone or Fibs could act as a bouncing spot if price shows bullish candlestick reactions.
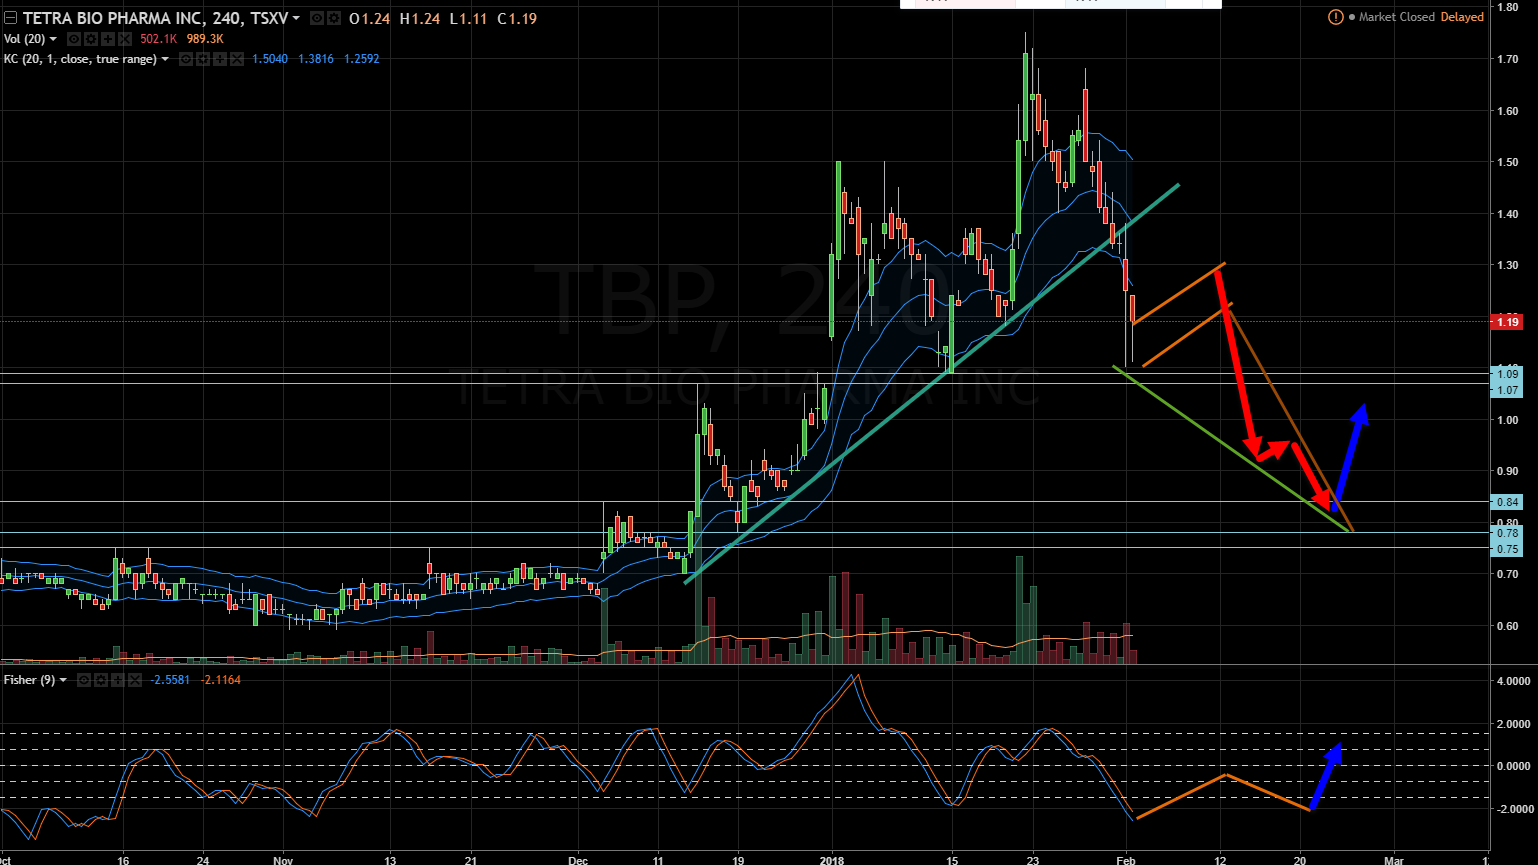
Tetra Price Chart
Aphiria broke below the support trend line and Keltner channel with strong bearish candlesticks. The bearish breakout is now testing key support levels, which could cause price to retrace first.
A bearflag chart pattern (orange lines) would confirm a likely bearish breakout and continuation (red arrows) towards the next support zone where a bullish reversal might appear (blue arrow).
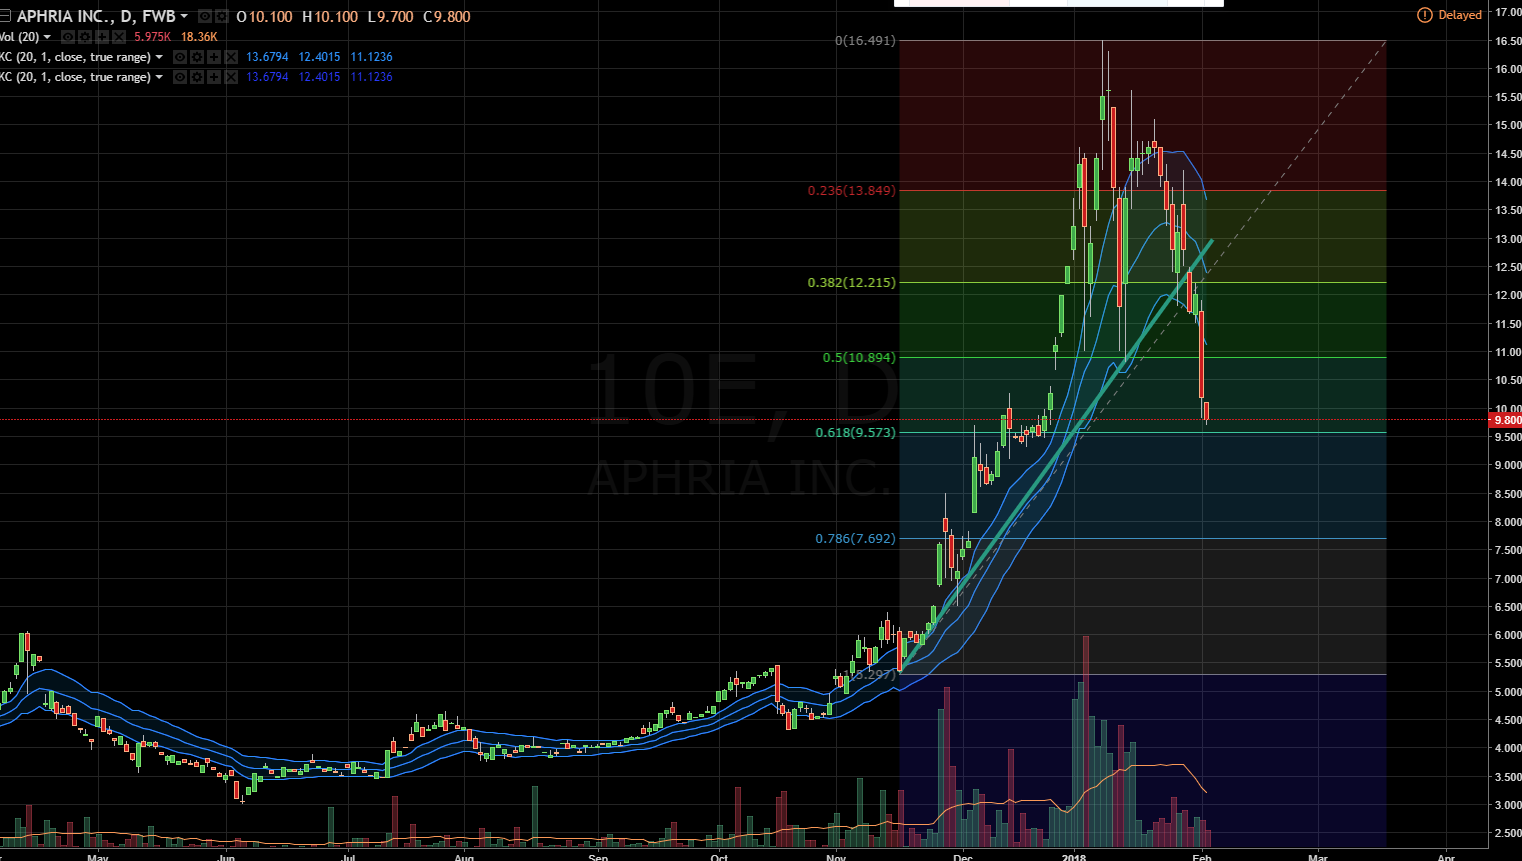
Aphria Price Chart
Aphiria is also showing a strong bearish breakout candle below the trend lines and Keltner channel. The bearish breakout is now testing the 61.8% Fib but considering the momentum, price is likely to continue lower after a bear flag chart pattern.
Wish you good trading!
Chris

.


Leave a Reply