BTC/USD Retracement ? Back to 50% Fibonacci Level at $4400
Subscribe
Hi trader,
we have been following BTC/USD for the last few months, including two BTC/USD trade setups. One was focused on a bullish break and hitting $5000 and the second was a bearish retracement back to around $3500 for a further uptrend continuation towards $5500.
Both scenarios played out exactly as expected: the bullish move hit $4950 (target was $5000) and the retracement went back to $3000 (bounce $3500) before ultimately hitting $5800 (target $5500) just a few days ago. Cha-ching! 🙂
Now the next question: what’s next? This article shares our vision for Bitcoin versus the US Dollar, BTC/USD, for the next weeks.
BTC/USD Bearish Daily Candles at $5800
Hopefully our target of $5500 for BTC/USD made you aware of the potential for a bearish bounce or reversal. Recently the bearish candles that appeared on the daily chart could have been an extra confirmation that price was about to build a bearish retracement. And it seems that this process has indeed started.
We expect that the bearish price action will take price back down (red arrow) to the 23.6% Fibonacci support level and steep inner trend line (blue) first of all. A small bullish reaction (green arrow) could take place there in the form of a bear flag but ultimately price will probably break (red arrows) below these support levels and reach a deeper Fib.
If price stays above the blue support trend line for 5-6 trading days after hitting the 23.6% Fib then the chances of an immediate trend continuation do increase.
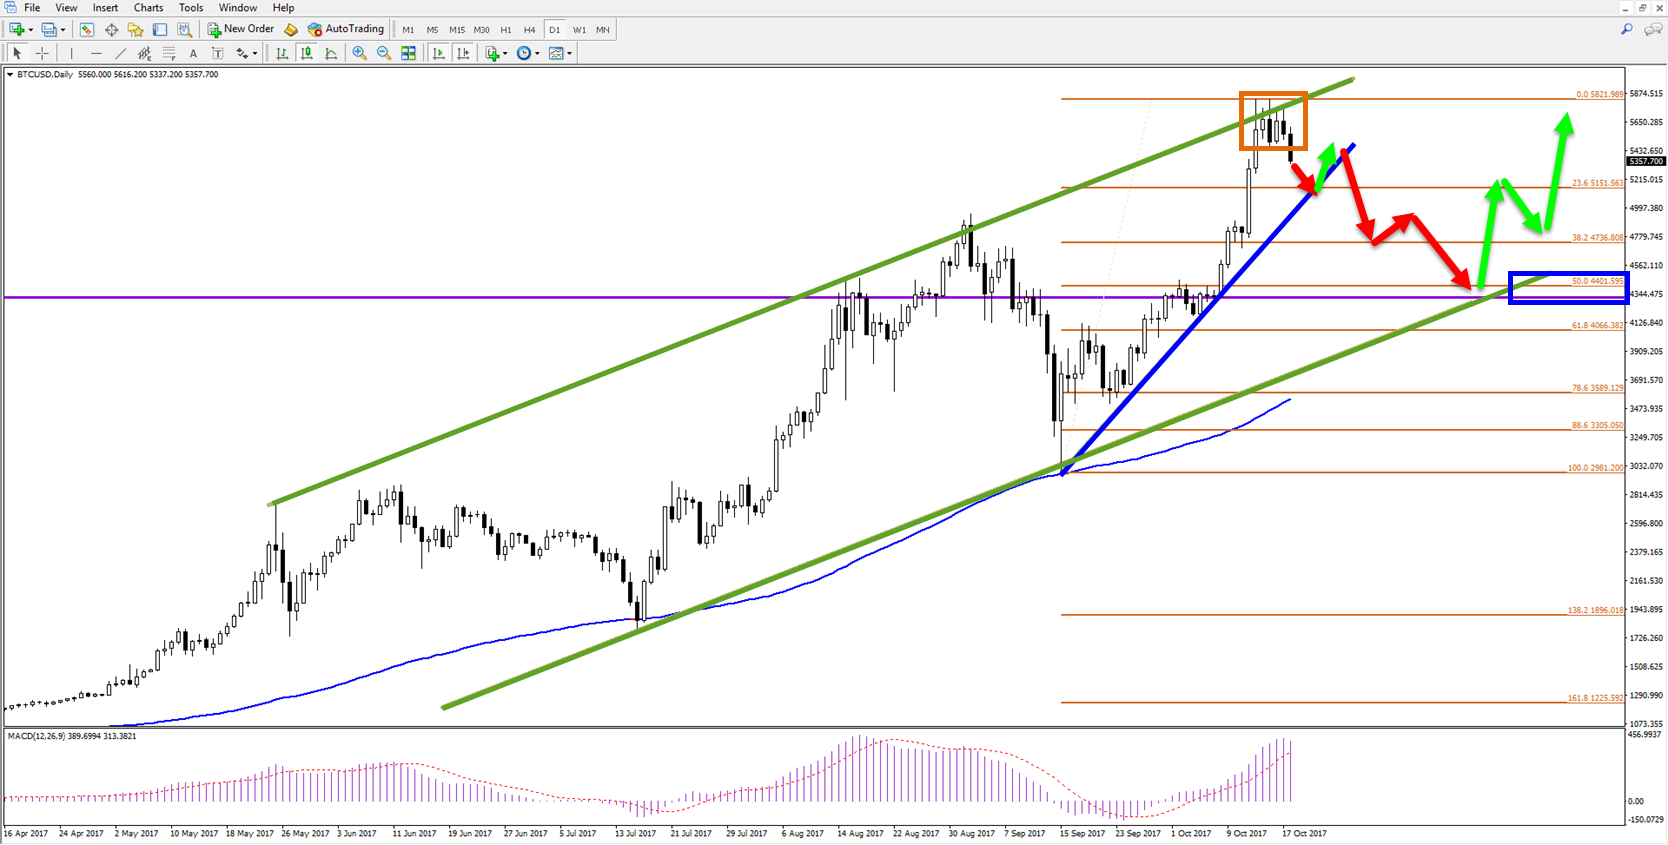
BTC/USD Retracement to $4400 and Continuation to $6600
Our best estimate is that price will retrace back to the 38.2% or 50% Fibonacci level and bottom of the uptrend channel (green lines). We not expect a deeper correction because typically the low (purple line) of a strong bullish monthly candlestick (such as September 2017) will not get broken.
From this support area, we expect the uptrend to continue (green arrows) towards the -27.2% Fibonacci target at around $6600.
A break below the uptrend channel, the 50% Fib (blue box) and last month’s low would invalidate the bullish outlook and indicate that a new bearish pattern might be unfolding.
ecs.LIVE Starts Monday and Offers 2 Week Free Trial
For more deeper and first class analysis and setups like this, check out our ecs.LIVE free 2 week trial.
There is really a ton of value:
- 3 live webinars (1 hour) per week, including CAMMACD setups by Nenad.
- Multiple CAMMACD charts and setups per week from Nenad.
- Daily SWAT setup from Chris.
- Multiple daily trade setups based on chart patterns, Fibs, and trend lines.
- Regular setups based on candlesticks, price action, and candlestick patterns.
- Daily market video highlighting the most interesting instruments.
- First class wave analysis on 11 instruments from Chris – including EUR/USD, GBP/USD, USD/JPY, EUR/JPY, GBP/JPY, AUD/USD, EUR/AUD, GBP/AUD, US oil, Gold (XAU/USD), and the German 30 (DAX index).
.123
Bitcoin Charts from Aug & Sep
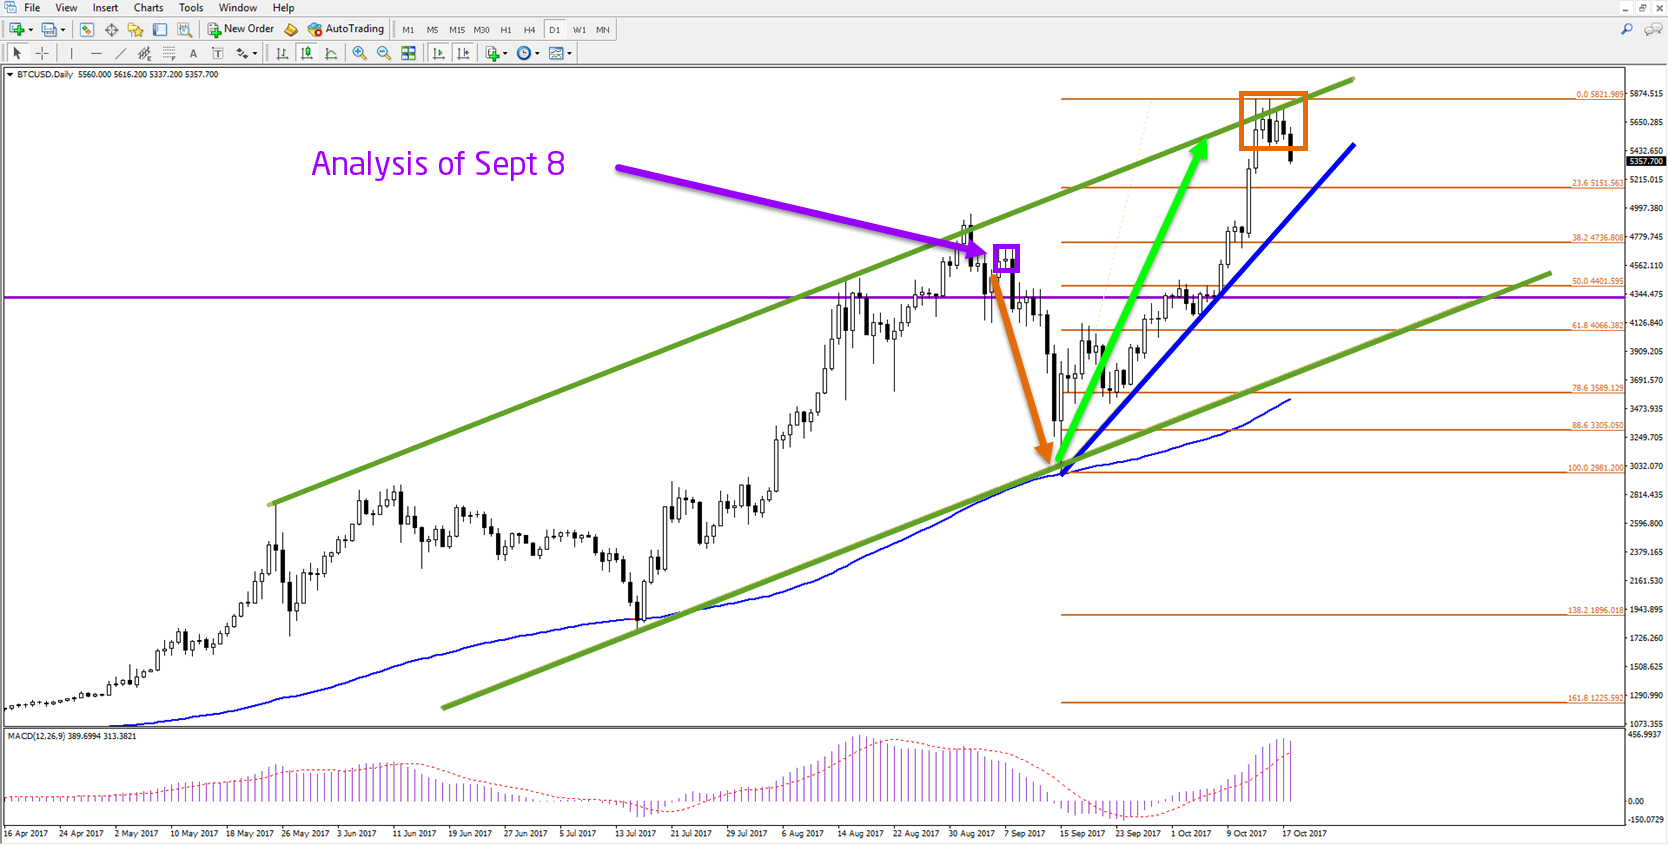
We mentioned our Bitcoin analysis in the introduction but we wanted to add the charts too so you can see pre-fact and post-fact.
After our analysis of August 28 the BTC/USD indeed made a bullish breakout and reached the -27.2% Fibonacci target.
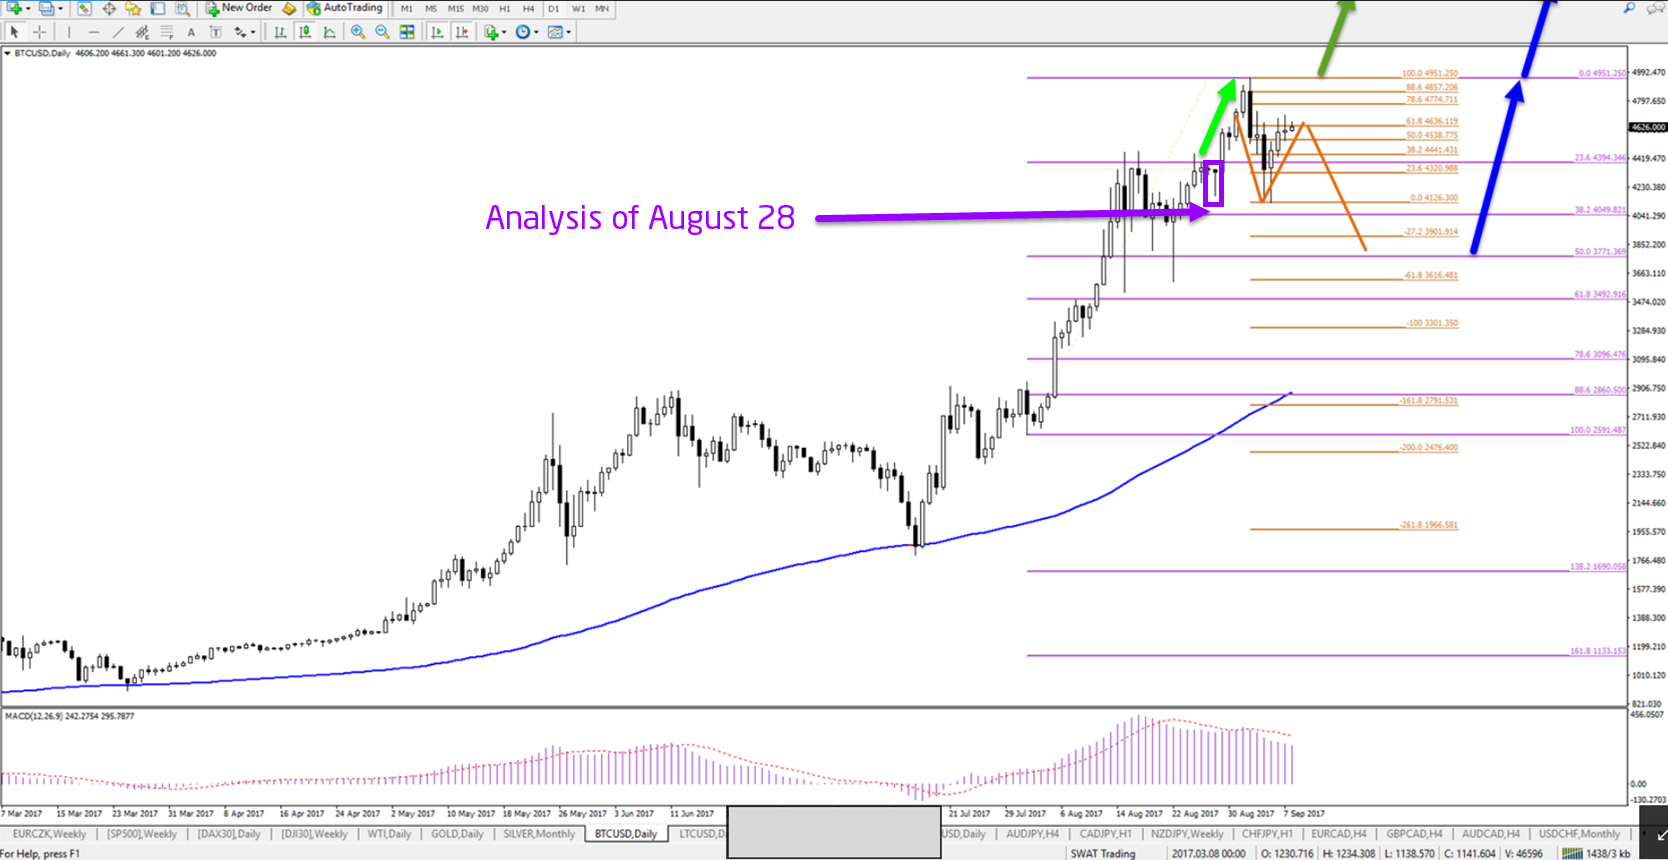
Then we expected a 3 wave correction above (orange lines) on September 8 which indeed happened by mid October:
Many Green Pips,
Chris
Oh and don’t forget to join our ecs.LIVE for a free 2 week trial!


Leave a Reply