? XAU/USD Bullish Break Makes Pullback to 78.6% Fibonacci ?
Subscribe
Hi traders,
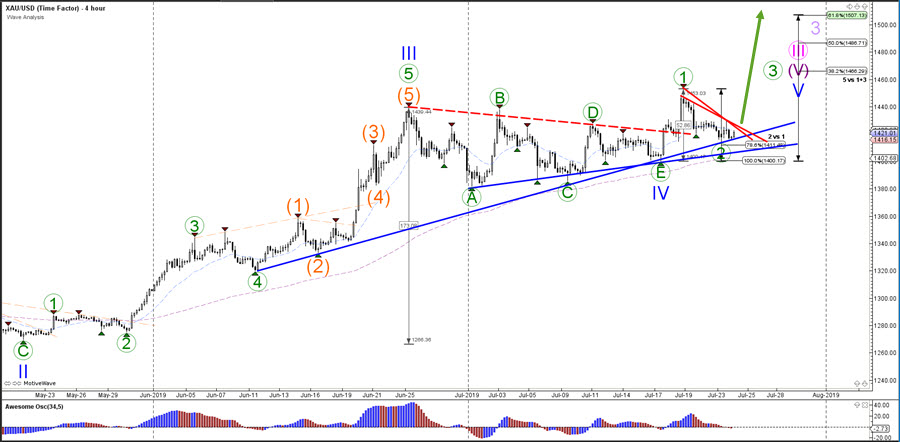
Gold (XAU/USD) made a bullish breakout above the resistance trend line (dotted red) but price quickly reverted lower again. Will the uptrend continue or will price show a bearish reversal?
XAU/USD
Daily
The current wave outlook is suggesting that the uptrend is not finished yet and a continuation of the bullish trend is likely to take place within a wave 3 (pink). The triangle chart pattern was most likely wave 4 (blue) consolidation and price has started a wave 5 (blue) breakout.

4 hour
The XAU/USD could have made a bullish wave 1 (green) and the current pullback could be a deep wave 2 (green) retracement. This wave outlook remains valid as long as price stays above the 100% Fibonacci levels of wave 2 vs 1. A break above the resistance trend lines (red) could indicate the start of the wave 3 (green) and a move higher towards the Fibonacci targets of wave 5 vs 1+3.
For more daily wave analysis and updates, sign-up up to our ecs.LIVE channel.
Good trading,
Chris Svorcik
Elite CurrenSea


Leave a Reply