☝️ XAU/USD ABC Zigzag Confirms Bearish Reversal ☝️
Subscribe
Hi traders,
the XAU/USD (gold) broke below the support trend line (dotted blue) after bouncing at the 61.8% Fibonacci retracement level of wave B vs A, which is confirming the bearish reversal that we expected at ecs.LIVE.
XAU/USD
Daily
The current XAU/USD wave outlook is indicating a bearish correction within a larger ABCDE (pink) triangle pattern. Price seems ready to build a bearish ABC (purple) zigzag pattern within wave E, which in turn could complete a wave 2 (purple) correction. The key bouncing spot for wave 2 is the 61.8% Fibonacci retracement level of wave E vd D.

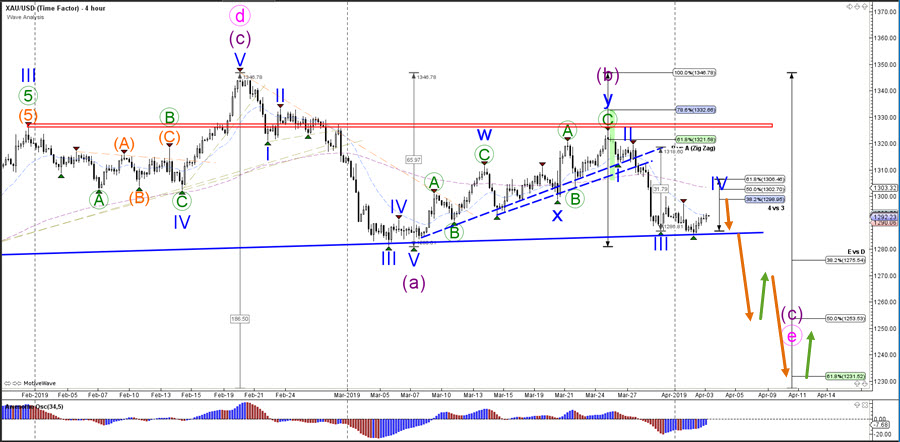
4 hour
The XAU/USD instrument is respecting the support trend line (blue), which could be part of a wave 4 (blue) correction as long as price stays below the 61.8% Fibonacci level. A bearish breakout confirms the continuation and downtrend (orange arrows).
For more daily wave analysis and updates, sign-up up to our ecs.LIVE channel.
Good trading,
Chris Svorcik
Elite CurrenSea


Leave a Reply