? USD/JPY Long-Term Wave Analysis 5 Nov ’18 ?
Subscribe
Hi traders,
The USD/JPY failed to break below the support trend line (blue) and made a bullish bounce instead. The bullish price action is approaching the Fibonacci levels of wave B vs A (pink), which could be a reversal spot.
USD/JPY
Daily

The USD/JPY bullish break above the 100% Fibonacci retracement level would invalidate the bearish ABC (pink) wave pattern whereas a bearish break below the support trend line (blue) makes the current wave pattern more likely.
Weekly
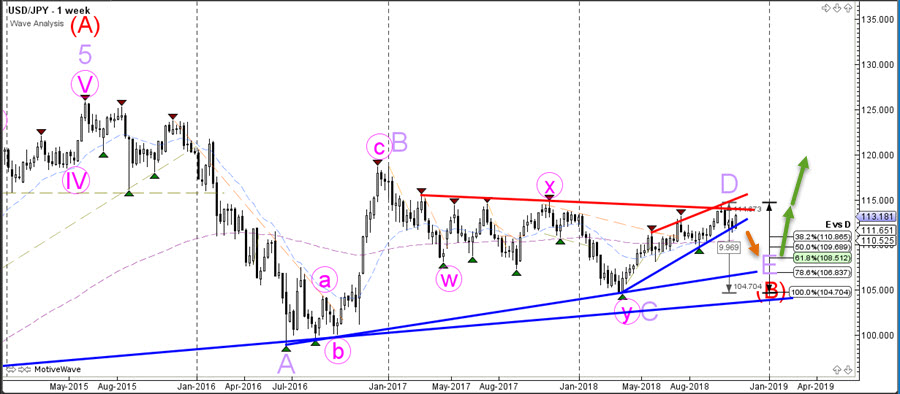
The USD/JPY is in a triangle chart pattern at the moment. A break above the resistance trend line could change the perspective but a bearish bounce could see price move lower towards the Fib levels of wave E vs D.
Monthly
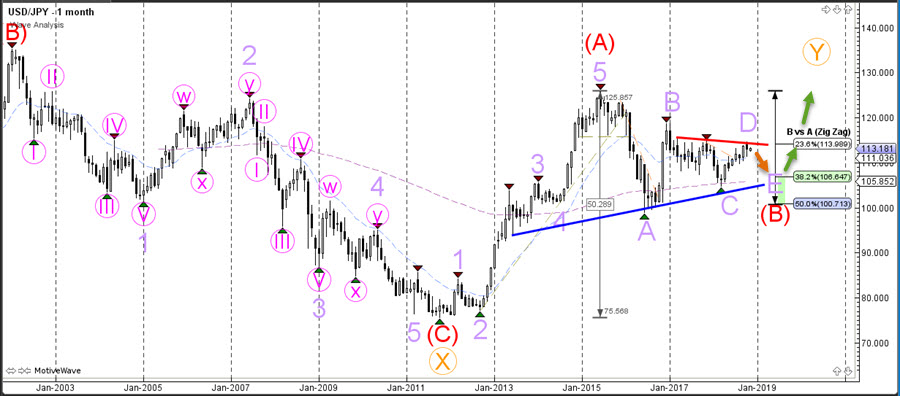
The USD/JPY is expected to make a bullish breakout towards the upside once the triangle chart pattern is completed.
For more daily wave analysis and updates, sign-up up to our ecs.LIVE channel.
Good trading,
Chris Svorcik
Elite CurrenSea


Leave a Reply