? USD/JPY Challenges 110 Key Resistance Zone for 2nd Attempt ?
May 7, 2018
2 min read
Subscribe
Hi traders,
the USD/JPY needs to break below the support trend lines (blue) near 109 before a larger bearish correction within wave X (pink) becomes more likely. A bullish breakout above the 110 resistance level could indicate an extension of the wave W (pink) towards the 50% Fib at 111.50.
USD/JPY
4 hour
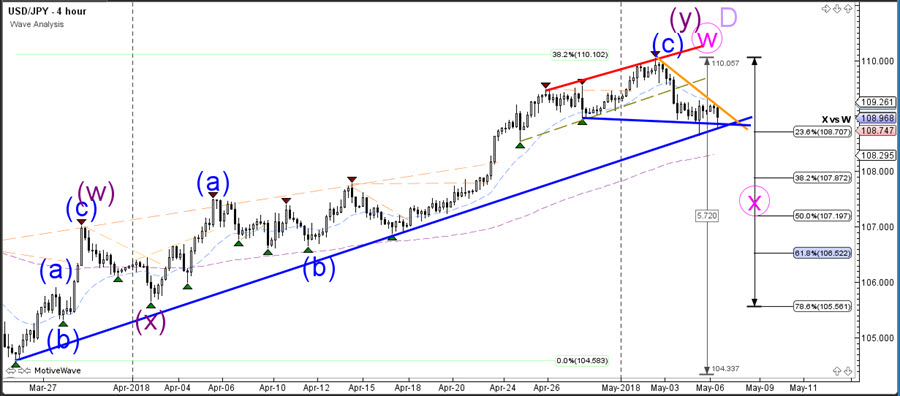
A break below 109 could see price fall towards 108 and 107.50 support levels.

1 hour
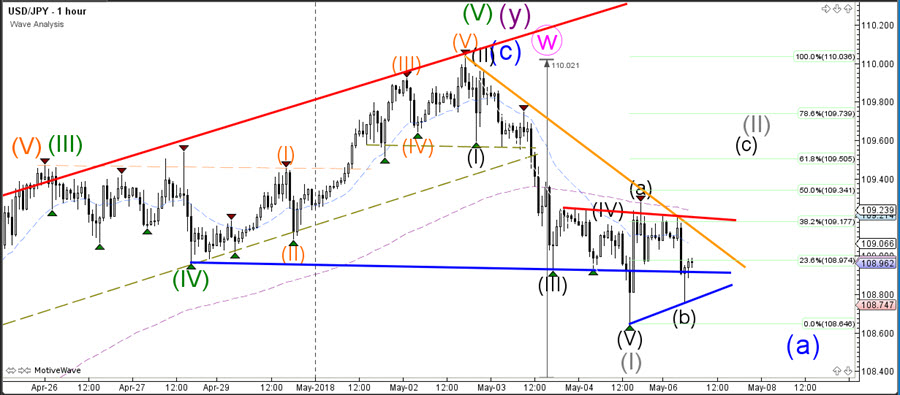
The USD/JPY could be building a wave 1-2 (grey) pattern within a larger wave A (blue). If price makes a bearish bounce at the Fibonacci levels of wave 2, then a larger ABC pattern could take place within wave A. A break above the 100% Fibonacci level and resistance zone at 110 invalidates the wave 1-2 pattern.
Good trading,
Chris Svorcik
Elite CurrenSea
.


Leave a Reply