USD/CAD – Bullish Bias…. An Indication for other USD Pairs?
Subscribe
Dear Traders,
The USD/CAD is showing a large bullish pattern. Today’s post will focus on wave analysis of the USD/CAD.
Leading Diagonal In the Making…
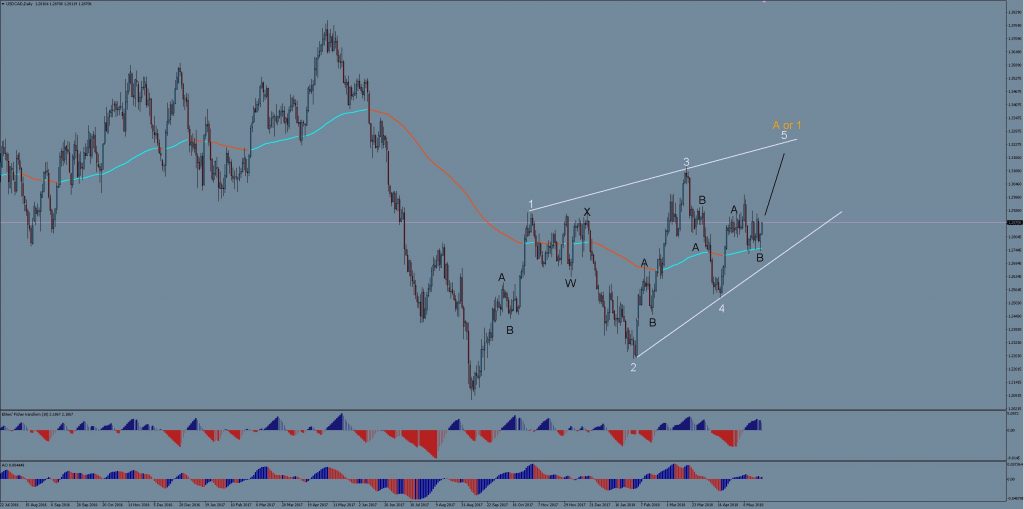
The Daily Chart shows us that the Loonie has been moving via 3-wave swings since the Sep 2017 low around 1.2060. The strong bullish bounce on Apr 17 2018 initiated the latest upswing and suggests that a leading diagonal (rising wedge) could be our prime suspect here, forming either wave 1 of a long-term uptrend continuation or wave A of a more complex correction (see orange label).
Overall the stronger momentum remains with the bulls, making an upwards continuation to complete the diagonal more likely in my view.
A bullish Wave 5 would target levels of at least 1.3120 (the previous wave 3) and higher. The 78.6% Fibonacci (ratio relative to wave 3) lies around 1.32 and could act as a realistic final target for the current move.
The USD/CAD chart has interesting implications for the USD overall because many other USD pairs are approaching critical price zones, which should act as bouncing zones that initiate the first bigger relief rally against the USD since its resurgence. If the USD/CAD analysis is correct, it means either that CAD will experience significant weakness by itself, or that USD strength will continue to dominate as a whole.
Should the support price zones of EUR/USD and GBP/USD fail to hold the USD in check, an extremely bullish USD picture could appear, with significant consequences for its longer-term outlook potentially.
All the best along your trading journey.
Hubert

.


Leave a Reply