? S&P500 Builds ABCDE Triangle after 38.2% Fib Bounce ?
Subscribe
Hi traders,
The long-term chart is showing a clear bullish 5 wave structure ever since the great recession in 2008. Price seems to be nearing the end of the wave 5 but trends can extend for a while before a correction takes place.
S&P500
Month
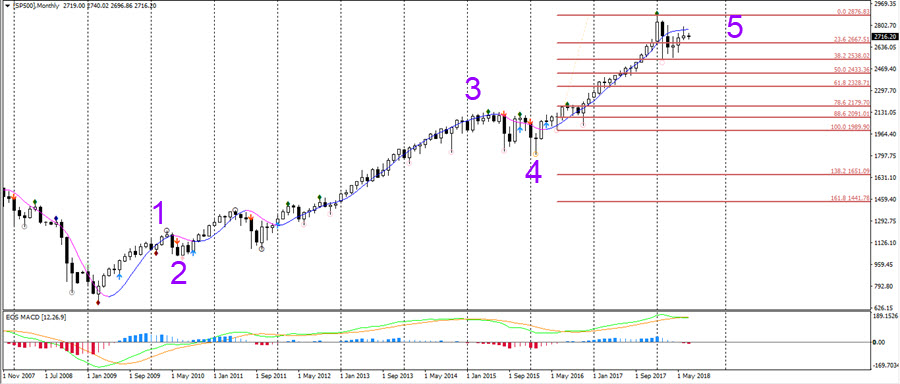
The current consolidation zone has respected and stopped at a 38.2% Fibonacci retracement level, which is indicating that price is probably building an internal wave 4.
Week
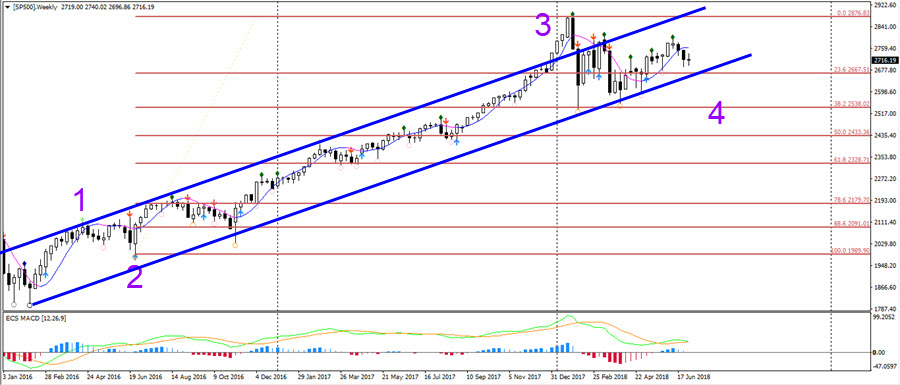
The weekly chart is showing the possibility of a wave 4 correction, which means that another higher high is possible as soon as price breaks above the consolidation zone. A break below the 50% Fib however would make such a wave 4 pattern unlikely. The next push up could in fact complete the uptrend with a wave 5 of wave 5.
Day
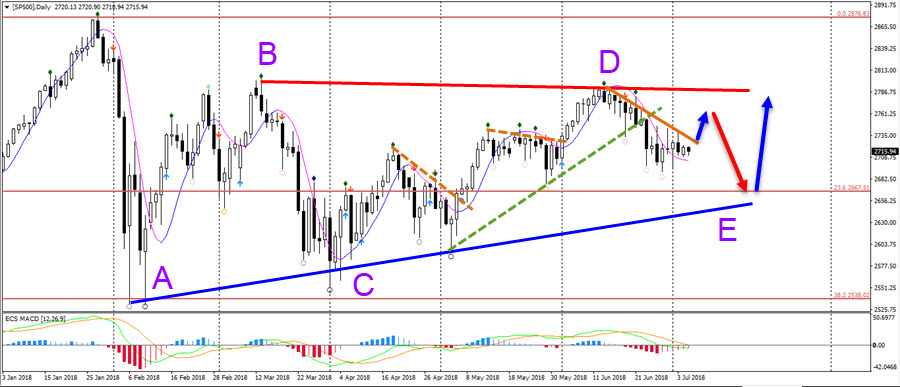
The daily chart is showing a potential ABCDE triangle pattern. A break below the bottom of wave C invalidates the pattern whereas a break above the wave D confirms the breakout.
Good trading,
Chris Svorcik
Elite CurrenSea


No reference at all to ecs Macd?
Hi Morris, good question. Not at the moment, but I think it could be very useful when price breaks out of the triangle. Will def comment on it in the future when its adding key info. Thanks! Chris