NZD/USD – Approaching Interesting Bounce Levels
Subscribe
Dear Traders,
I reported on the bearish outlook for the AUD/USD a few days ago. The NZDUSD is showing a potentially very different and a lot more bullish structure. This brings some interesting dynamics into the USD mix. Today’s analysis will focus on wave patterns of the NZD/USD.
A Large Wave 2… or Something Else
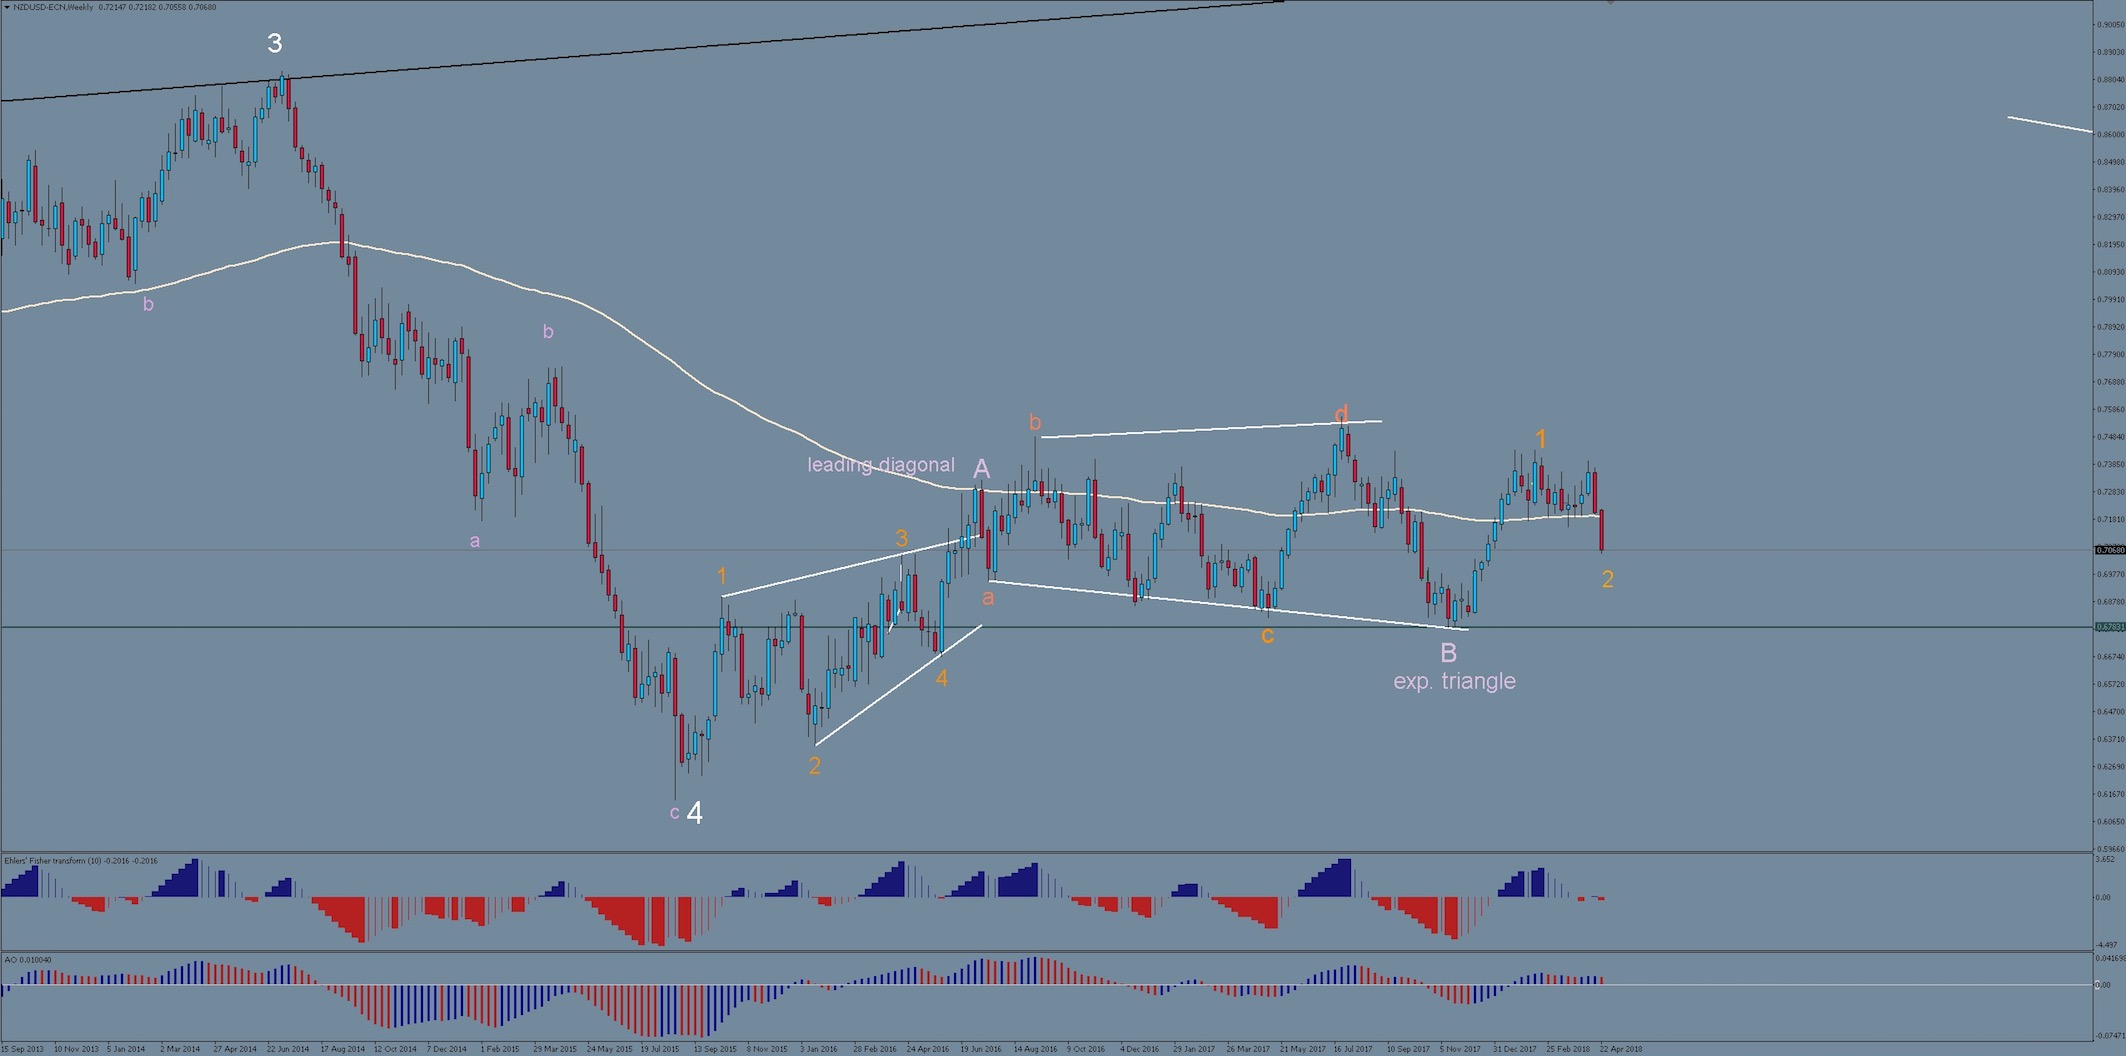
The bigger picture for the NZD/USD looks quite bullish, with the pair having potentially finished an expanding triangle of wave b (pink) at the November 2017 low. It opens up the space for a significant uptrend. The bullish swing from Nov 2017 – 16th Feb 2018 could have been Wave 1 (orange) of a large impulse to the upside. Other scenarios are not easy to fit into the longer-term price structure.
Just like many other USD charts, the NZDUSD has been tracing out a complex corrective pattern since the high of Feb 16, which is probably forming wave 2 (orange) of an uptrend in the NZD/USD’s case. The correction seems to be creating either a Flat or double zigzag. The internal structure breaks down as follows:
turquoise A fits best into a zigzag by itself, with the first swing being a leading diagonal (green a). Turquoise B is difficult to pin down and leaves several options on the table (double zigzag, or zigzag with a running flat), but the important factor here is that it fits a corrective wave B (turquoise).
The recent bearish impulse fits well as into turquoise C. If the overall correction is a flat, then only one 5-wave impulse to the downside is required to complete the overall correction of wave 2. However turquoise B retraced less than 90% percent of turquoise A, which make the flat scenario more questionable, and leaves the door open for the structure to become an overall double zigzag. This would require an upwards correction of the latest bearish swing, followed by another motive wave to the downside, in order to complete a full double zigzag from the Feb 16 high.
The depth of the retracement is normal for a large wave 2 and we should see a bullish reaction at the 61.8 or 78.6 Fibonacci levels (0.7030 and 0.6920). If we get a series of small bullish impulses that create a couple of higher highs and higher lows, the stage could be set for a significant upside.
This outlook stands in stark contrast to my recent AUD/USD analysis, which was pointing towards a very bearish scenario. This raises certain questions because NZD/USD and AUD/USD are generally fairly well correlated with each other. This either hints at the likelihood that the AUD/USD will be able to perform a bullish bounce before it breaks below 0.75 (which would be a major invalidation level for bulls), or that a major divergence would occur between the AUD and NZD. The AUD/NZD was analyzed during a previous post, and leaves room for more AUD weakness, but the NZD/USD chart is making an interesting case for the possibility that the AUD/USD may also be able to perform a similar bullish feat before it’s ‘too late’.
All the best along your trading journey
Hubert
.


Leave a Reply